
Homework Answers
To do the simulation in excel first go to File -> Options -> Add-Ins -> select Analysis ToolPak -> Click on 'Go' -> Again check Analysis ToolPak -> Click on 'Ok'.
Then go to Data -> Click on 'Data Analysis' from the extreme right -> Select 'Random Number Generation' -> Click 'Ok'.
Then a dialogue box will be opened. There, insert 4 as the Number of variables and 1000 the number of random numbers for each of the 4 variables. Choose 'Normal' in the dropdown list for Distribution. Enter mean as 3.5 as standard deviation 1.7078. Select the output range that is, the area in the Excel worksheet where you want the output to appear. Then click 'OK'.
Now in the 4 columns, you will have the data. Now, for each of the 1000 rows take mean of 4 columns and insert it into the 5th column. Now, this fifth column contains 1000 averages of 4 observations.
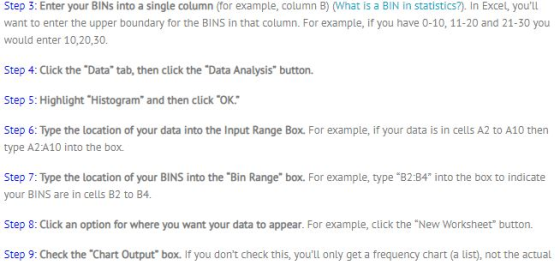
Then click "OK" and the histogram will be obtained.
1. The histogram obtained after the simulation study is as follows -


2- A process is controlled with a fraction nonconforming control chart with 3-sigma limits, n-100, UCL=0.161,...
 2- A process is controlled with a fraction nonconforming control chart with 3-sigma limits, n-100, UCL=0.161, CL:0.08, and LCL=0·Find the equivalent control chart for the number nonconforming.
I will rate 2. A process has a X-bar control chart with UCL-17.4. LCL-12.79 using a...
 I
will rate
2. A process has a X-bar control chart with UCL-17.4. LCL-12.79 using a 3-sigma limit. The subgroup sample size is 3. (a) Estimate the standard deviation of the process, sigma hat. (6 pts) (b) Suppose that the process mean shifts to 13. Find the probability that this shift will be detected on the next sample. (8 pts) (c) Calculate the average run length (ARL) before detecting the shift. (6 pts)
I
will rate
2. A process has a X-bar control chart with UCL-17.4. LCL-12.79 using a 3-sigma limit. The subgroup sample size is 3. (a) Estimate the standard deviation of the process, sigma hat. (6 pts) (b) Suppose that the process mean shifts to 13. Find the probability that this shift will be detected on the next sample. (8 pts) (c) Calculate the average run length (ARL) before detecting the shift. (6 pts)
2. A process has a X-bar control chart with UCL=17.4, LCL=12.79 using a 3- sigma limit....
 2. A process has a X-bar control chart with UCL=17.4, LCL=12.79 using a 3- sigma limit. The subgroup sample size is 3. (a) Estimate the standard deviation of the process, sigma hat. (6 pts) (b) Suppose that the process mean shifts to 13. Find the probability that this shift will be detected on the next sample. (8 pts) (c) Calculate the average run length (ARL) before detecting the shift. (6 pts)
I need help getting the UCL and LCL ePage-61919.20 x)" course Home hrome-Do Homework-dylan Boest 을...
 I need help getting the UCL and LCL
ePage-61919.20 x)" course Home hrome-Do Homework-dylan Boest 을 Secure | https://www.mathxl.com/Student/PlayerHomework.aspx?homeworkid-493290252&qu Operations Management Sat Homework: Chapter S6 Homework Score: 0 of 1 pt 3 of 11 (2 complete) HW Score: 0%, 0 of 11 X Problem 6s.16 EQuestion Help The defect rate for your product has historically been about 1.00%. For a sample size of 500, the upper and lower 3-sigma control chart limits are: UCLp-(enter your response as a number between...
I need help getting the UCL and LCL
ePage-61919.20 x)" course Home hrome-Do Homework-dylan Boest 을 Secure | https://www.mathxl.com/Student/PlayerHomework.aspx?homeworkid-493290252&qu Operations Management Sat Homework: Chapter S6 Homework Score: 0 of 1 pt 3 of 11 (2 complete) HW Score: 0%, 0 of 11 X Problem 6s.16 EQuestion Help The defect rate for your product has historically been about 1.00%. For a sample size of 500, the upper and lower 3-sigma control chart limits are: UCLp-(enter your response as a number between...
Given the following measurements representing 10 samples of size 3. find the s-bar, UCL and LCL...
 Given the following measurements representing 10 samples of size 3. find the s-bar, UCL and LCL for a S-bar chart. Is the process in control 2 3 4 5 6 7 8 9 | 10A 10 5 10 8 9 88 892 | 102 103 104 105 101 103N00EUBU 9.94 0.9 103 10.8 || 10 H104 10. 610103 0 19.79 10 3 102 s-bar 027 UCL 0.68 LCL 0 1 The process is in control s-bar 0.27 UCL 0.65 LCLLO...
Please answer to all parts of the problems. Do not answer if you do not get the right answer. Tha...
 Please answer to all parts of the problems. Do not answer if you
do not get the right answer. Thank you!
Control charts are to be kept on the thickness measurements for a process that rolls 10-gage copper sheets. The current specification in the sheets is 0.1360+0.0020 inch. After collecting 25 samples of n 5 measurements at approximately half-hour intervals, the data were used to determine Σ L:3.421 inches and R.-0.044 inches, with i1 to 25. Assume that the quality...
Please answer to all parts of the problems. Do not answer if you
do not get the right answer. Thank you!
Control charts are to be kept on the thickness measurements for a process that rolls 10-gage copper sheets. The current specification in the sheets is 0.1360+0.0020 inch. After collecting 25 samples of n 5 measurements at approximately half-hour intervals, the data were used to determine Σ L:3.421 inches and R.-0.044 inches, with i1 to 25. Assume that the quality...
Problem 5 [Pencil version] An X-bar chart is to be established with u= 100, o=8 (i.e.,...
 Problem 5 [Pencil version] An X-bar chart is to be established with u= 100, o=8 (i.e., process standard deviation = 8), and n = 4. Note that European countries use the 0.002 probability limits instead of the 3-sigma limits. Obtain their corresponding 0.002 probability limits (i.e., obtain their UCL, CL, and LCL). This exercise was done in class, but redo it and show your work.
Refer to Table 56.1 - Factors for Computing Control Chart Limits (sigma) for this problem. Thirty-five...
 Refer to Table 56.1 - Factors for Computing Control Chart Limits (sigma) for this problem. Thirty-five samples of size 7 each were taken from a fertilizer-bag-filling machine at Panos Kouvels Lifelong Lawn Lid. The results were: Overal mean = 54.75 lb.: Average range R 164 b. a) For the given sample size, the control limits for 3-sigma x chart are Upper Control Limit (UCL) - D. (round your response to three decimal places). Lower Control Limit (LCL)-1. (round your response...
i dont have any more informafoon to add besides rhis pther example of tne type of...
 i
dont have any more informafoon to add besides rhis pther example of
tne type of problem
0405/20 1:47 Homework: Chapter S6 Homework Score: 0 of 1 pt + 2 of 7 (4 complete) Problem 6s.16 HW Score: 46.43%, 3.25 of The defect rate for your product has historically been about 1.00%. For a sample size of 400, the upper and lower 3-sigma control chart limits are: Question Help UCL = enter your response as a number between 0 and...
i
dont have any more informafoon to add besides rhis pther example of
tne type of problem
0405/20 1:47 Homework: Chapter S6 Homework Score: 0 of 1 pt + 2 of 7 (4 complete) Problem 6s.16 HW Score: 46.43%, 3.25 of The defect rate for your product has historically been about 1.00%. For a sample size of 400, the upper and lower 3-sigma control chart limits are: Question Help UCL = enter your response as a number between 0 and...
I already have calculated for question #4 and got these numbers xdouble bar=28.07 UCL=29.08 LCL=27.08 ,Rbar=1.74,...
I already have calculated for question #4 and got these numbers xdouble bar=28.07 UCL=29.08 LCL=27.08 ,Rbar=1.74, UCL=3.67, LCL=0 Sample Size=5 Continuing on from question #4, the employee continues to track the same data for 10 weeks after the supplier change, and gets the following data: Sample data: 1 2 3 4 5 6 7 8 9 10 Mean 27.8 28.9 27.4 28.7 28.0 27.1 27.2 27.3 28.0 27.4 Range 2.3 1.5 3.0 2.1 3.2 2.2 3.6 2.0 3.4 1.7 The...
 2- A process is controlled with a fraction nonconforming control chart with 3-sigma limits, n-100, UCL=0.161, CL:0.08, and LCL=0·Find the equivalent control chart for the number nonconforming.
 I
will rate
2. A process has a X-bar control chart with UCL-17.4. LCL-12.79 using a 3-sigma limit. The subgroup sample size is 3. (a) Estimate the standard deviation of the process, sigma hat. (6 pts) (b) Suppose that the process mean shifts to 13. Find the probability that this shift will be detected on the next sample. (8 pts) (c) Calculate the average run length (ARL) before detecting the shift. (6 pts)
I
will rate
2. A process has a X-bar control chart with UCL-17.4. LCL-12.79 using a 3-sigma limit. The subgroup sample size is 3. (a) Estimate the standard deviation of the process, sigma hat. (6 pts) (b) Suppose that the process mean shifts to 13. Find the probability that this shift will be detected on the next sample. (8 pts) (c) Calculate the average run length (ARL) before detecting the shift. (6 pts)
 2. A process has a X-bar control chart with UCL=17.4, LCL=12.79 using a 3- sigma limit. The subgroup sample size is 3. (a) Estimate the standard deviation of the process, sigma hat. (6 pts) (b) Suppose that the process mean shifts to 13. Find the probability that this shift will be detected on the next sample. (8 pts) (c) Calculate the average run length (ARL) before detecting the shift. (6 pts)
 I need help getting the UCL and LCL
ePage-61919.20 x)" course Home hrome-Do Homework-dylan Boest 을 Secure | https://www.mathxl.com/Student/PlayerHomework.aspx?homeworkid-493290252&qu Operations Management Sat Homework: Chapter S6 Homework Score: 0 of 1 pt 3 of 11 (2 complete) HW Score: 0%, 0 of 11 X Problem 6s.16 EQuestion Help The defect rate for your product has historically been about 1.00%. For a sample size of 500, the upper and lower 3-sigma control chart limits are: UCLp-(enter your response as a number between...
I need help getting the UCL and LCL
ePage-61919.20 x)" course Home hrome-Do Homework-dylan Boest 을 Secure | https://www.mathxl.com/Student/PlayerHomework.aspx?homeworkid-493290252&qu Operations Management Sat Homework: Chapter S6 Homework Score: 0 of 1 pt 3 of 11 (2 complete) HW Score: 0%, 0 of 11 X Problem 6s.16 EQuestion Help The defect rate for your product has historically been about 1.00%. For a sample size of 500, the upper and lower 3-sigma control chart limits are: UCLp-(enter your response as a number between...
 Given the following measurements representing 10 samples of size 3. find the s-bar, UCL and LCL for a S-bar chart. Is the process in control 2 3 4 5 6 7 8 9 | 10A 10 5 10 8 9 88 892 | 102 103 104 105 101 103N00EUBU 9.94 0.9 103 10.8 || 10 H104 10. 610103 0 19.79 10 3 102 s-bar 027 UCL 0.68 LCL 0 1 The process is in control s-bar 0.27 UCL 0.65 LCLLO...
 Please answer to all parts of the problems. Do not answer if you
do not get the right answer. Thank you!
Control charts are to be kept on the thickness measurements for a process that rolls 10-gage copper sheets. The current specification in the sheets is 0.1360+0.0020 inch. After collecting 25 samples of n 5 measurements at approximately half-hour intervals, the data were used to determine Σ L:3.421 inches and R.-0.044 inches, with i1 to 25. Assume that the quality...
Please answer to all parts of the problems. Do not answer if you
do not get the right answer. Thank you!
Control charts are to be kept on the thickness measurements for a process that rolls 10-gage copper sheets. The current specification in the sheets is 0.1360+0.0020 inch. After collecting 25 samples of n 5 measurements at approximately half-hour intervals, the data were used to determine Σ L:3.421 inches and R.-0.044 inches, with i1 to 25. Assume that the quality...
 Problem 5 [Pencil version] An X-bar chart is to be established with u= 100, o=8 (i.e., process standard deviation = 8), and n = 4. Note that European countries use the 0.002 probability limits instead of the 3-sigma limits. Obtain their corresponding 0.002 probability limits (i.e., obtain their UCL, CL, and LCL). This exercise was done in class, but redo it and show your work.
 Refer to Table 56.1 - Factors for Computing Control Chart Limits (sigma) for this problem. Thirty-five samples of size 7 each were taken from a fertilizer-bag-filling machine at Panos Kouvels Lifelong Lawn Lid. The results were: Overal mean = 54.75 lb.: Average range R 164 b. a) For the given sample size, the control limits for 3-sigma x chart are Upper Control Limit (UCL) - D. (round your response to three decimal places). Lower Control Limit (LCL)-1. (round your response...
 i
dont have any more informafoon to add besides rhis pther example of
tne type of problem
0405/20 1:47 Homework: Chapter S6 Homework Score: 0 of 1 pt + 2 of 7 (4 complete) Problem 6s.16 HW Score: 46.43%, 3.25 of The defect rate for your product has historically been about 1.00%. For a sample size of 400, the upper and lower 3-sigma control chart limits are: Question Help UCL = enter your response as a number between 0 and...
i
dont have any more informafoon to add besides rhis pther example of
tne type of problem
0405/20 1:47 Homework: Chapter S6 Homework Score: 0 of 1 pt + 2 of 7 (4 complete) Problem 6s.16 HW Score: 46.43%, 3.25 of The defect rate for your product has historically been about 1.00%. For a sample size of 400, the upper and lower 3-sigma control chart limits are: Question Help UCL = enter your response as a number between 0 and...
Most questions answered within 3 hours.
-
An empty test tube weighs 15.923 grams. Then,
MgCl2•6H2O is added into the test tube. After...
asked 28 minutes ago -
Please answer true or false. Words
cannot be changed or added in to make it true...
asked 27 minutes ago -
(a) A piston at 6.1 atm contains a gas that occupies a volume of
3.5 L....
asked 28 minutes ago -
Assume memory access is 10 units of time and disk access is
10000 units of time....
asked 46 minutes ago -
1. Are all good samples random?
2. Magazines often report surveys giving statistics such as “63%...
asked 1 hour ago -
Under all the various types of market structures, firms
must eventually earn some economic profits for...
asked 54 minutes ago -
Consider the following fitness regime for a single locus trait
with two co-dominant alleles: w11 =...
asked 59 minutes ago -
A large cable company reports the following.
80% of its customers subscribe to its cable TV...
asked 1 hour ago -
Please answer the question in brief.
Discuss the role of ERP in organizations. Are ERP tools...
asked 1 hour ago -
Discuss the pros and cons of collaborative software such
as SameTime. Does it increase productivity? What...
asked 1 hour ago -
Buying your in-laws a gift because it’s expected is
due to the ____________ motive of gift-giving....
asked 1 hour ago -
Calculate the expected value, the variance, and the standard
deviation of the given random variable X....
asked 1 hour ago