
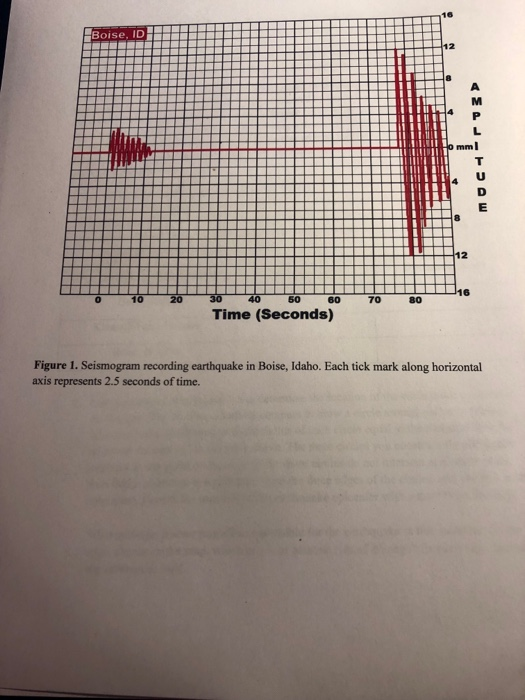


16 Boise, ID 12 mml 12 16 10 20 30 40 50 60 80 70 Time (Seconds) Figure 1. Seismogram recording earthquake in Boise, Idaho. Each tick mark along horizontal axis represents 2.5 seconds of time. TUDE
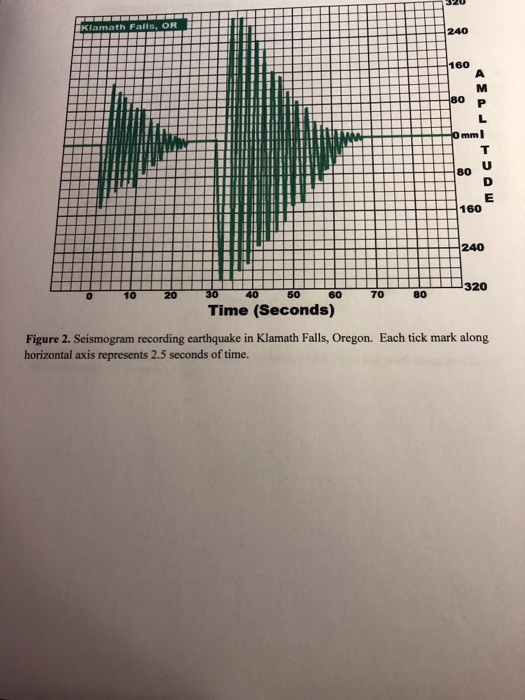
370 Klamath Falls, OR 240 160 A M 80 P L O mm T U 80 E 160 240 320 60 80 30 40 50 20 70 10 Time (Seconds) Figure 2. Seismogram recording earthquake in Klamath Falls, Oregon. Each tick mark along horizontal axis represents 2.5 seconds of time.
40 IReno, Nvi 30 20 10 P L O mm S T U 10 20 30 40 30 40 50 60 80 10 20 70 Time (Seconds) Figure 3. Seismogram recording earthquake in Reno, Nevada. Each tick mark along horizontal axis represents 2.5 seconds of time.
S-Wave 80 P-Wave 70 60 S-P 50 40 30 20 10 100 200 300 400 500 600 700 800 Distance (Kilometers) Figure 4. Travel-time curve displaying the amount of time (seconds) that it takes P- and S- Waves to travel certain distances (kilometers). In addition, S- P interval is given as a function of distance. Time (Seconds)
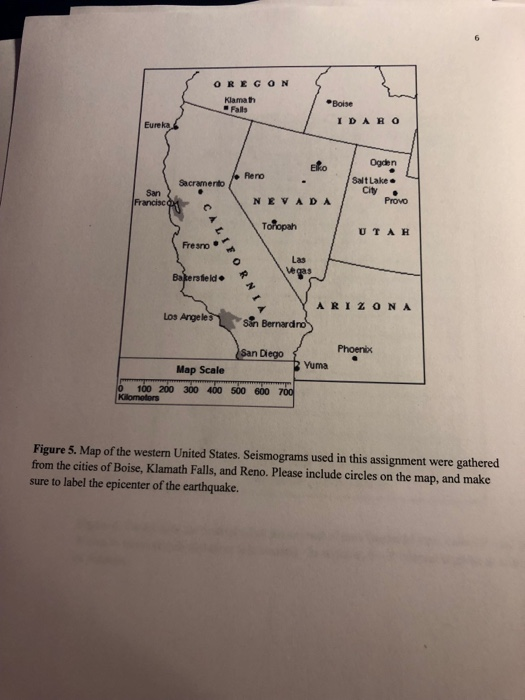
OREG ON Klama th Boise Falls IDARO EurekaA Ogden Elo Reno Salt Lake City Provo Sacramento San NEVADA Francisc Toopah UTAH Fresno Las e gas Baterstle ld ARIZ ONA Los Ange les San Bernardno Phoenix San Diego Yuma Map Scale www.ea 100 200 300 400 500 600 700 Kilometors Figure 5. Map of the western United States. Seismograms used in this assignment were from the cities of Boise, Klamath Falls, and Reno. Please include circles on the map, and make sure to label the epicenter of the earthquake. gathered :ALIFORNIA
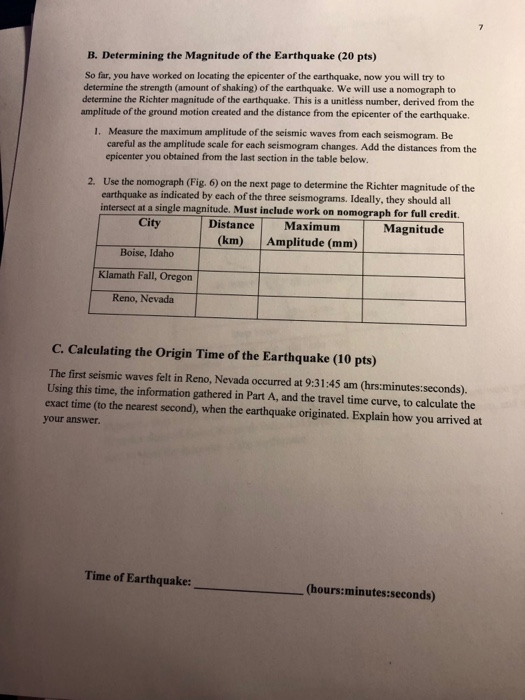
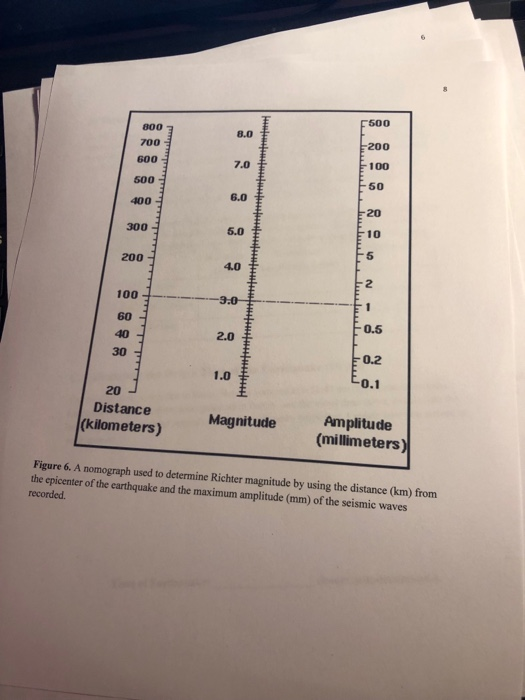
B. Determining the Magnitude of the Earthquake (20 pts) So far, you have worked on locating the epicenter of the earthquake, now you will try to determine the strength (amount of shaking) of the earthquake. We will use a nomograph to determine the Richter magnitude of the earthquake. This is a unitless number, derived from the amplitude of the ground motion created and the distance from the epicenter of the earthquake. 1. Measure the maximum amplitude of the seismic waves from each seismogram. Be careful as the amplitude scale for each seismogram changes. Add the distances from the epicenter you obtained from the last section in the table below. 2. Use the nomograph (Fig. 6) on the next page to determine the Richter magnitude of the earthquake as indicated by each of the three seismograms. Ideally, they should all intersect at a single magnitude. Must include work on nomograph for full credit. Distance City Maximum Magnitude Amplitude (mm) (km) Boise, Idaho Klamath Fall, Oregon Reno, Nevada C. Calculating the Origin Time of the Earthquake (10 pts) The first seismic waves felt in Reno, Nevada occurred at 9:31:45 am (hrs:minutes:seconds). Using this time, the information gathered in Part A, and the travel time curve, to calculate the exact time (to the nearest second), when the earthquake originated. Explain how you arrived at your answer. Time of Earthquake: . (hours: minutes : seconds)
500 800 8.0 200 700 600 100 7.0 F50 500 6.0 400 20 300 10 5.0 5 200 4.0 2 100 -9:0 1 60 0.5 2.0 40 30 0.2 1.0 0.1 20 Distance Amplitude (millimeters) Magnitude (kilometers) Figure 6. A nomograph used to determine Richter magnitude by using the distance (km) from the epicenter of the carthquake and the maximum amplitude (mm) of the seismic waves recorded.
Homework Answers
From the graphs and the nomograph and the graphs provided the following table can be completed. The first waves at any site are always P waves, which are followed by S-waves.
| City | S-P | Distance | Maximum Amplitude | Magnitude |
| Boise | 65 | 640 | 12 | 6.6 |
| Klamath Falls | 7.5 | 80 | 300 | 5.5 |
| Reno | 42.5 | 420 | 31 | 6 |
Nomographs are used in the following way:
Join the maximum amplitude with the distance by a straight line. The intersection with the magnitude scale is the magnitude of the earthquake in that region. Note that the readings in this case may be off since the photograph provided is tilted.

Since I cannot draw accurate circles on the image, it is difficult for me to demonstrate how I found the epicenter, but I can explain the procedure. Using the scale provided, we use the distance from the epicenter calculated as the radius and draw three circles. The intersection of these circles gives us the epicenter, which in this case is Eureka, California.
The structural feature causing the earthquake is probably the Sand Andreas fault.
C. Since the earthquake was felt at 9:31:45 am in Reno, we can calculate the time it originated, since we know the distance of Reno from the epicenter (420 km), as well as the average P wave velocity (6.7 km/s).
It took a total of 420/6.7 = 62.6 s for the earthquake to reach Reno. Thus, it originated at 9:30:42.4 am.
Add Answer to:
Earthquake Lab: Locating the Epicenter, Determining the Magnitude, and Calculating the Time of Earthquake The goal...
EXERCISE 11,4 Locating an Earthquakes Epicenter and Determining When It Occurred (continued) Name Course Section: Date:...
 EXERCISE 11,4 Locating an Earthquakes Epicenter and Determining When It Occurred (continued) Name Course Section: Date: Arrival times and delays between seismic waves Boston Los Angeles Seattle Selmic wave arrival times Delays between seismic waves S-P Step 3: Estimating Distance from the Epicenter to Each Station Using the Travel-Time Diagram The next figure in this exercise shows how to use seismic wave delay data and the travel time diagram to measure the distance from each station to the epicenter. Start...
Alpine-Himalayan Ocean Paoiño Ocean Ocean Deep eartho EXERCISE 16.2 Locating Earthquake Epicenters Name: Course Section: Date:...
 Alpine-Himalayan Ocean Paoiño Ocean Ocean Deep eartho EXERCISE 16.2 Locating Earthquake Epicenters Name: Course Section: Date: This exercise leads you through the reasoning used to calculate the distance from a seismic station to epicenter. But instead of two different seismic waves, let's see first how this works with two cars that start along a road at exactly the same time (see the figure on the next page). Both use cruise control set at 1 mile per minute (60 miles per...
You live in the Berkeley Hills and are outside walking your dog. Abrupt strong earthquake shaking...
 You live in the Berkeley Hills and are outside walking your dog.
Abrupt strong earthquake shaking commences. Which is the best
course of action?
Earthquake warning systems will provide about 10-15 seconds of
warning on average for Bay Area residents. The size of the
time warning window depends on:
Question 21 You live in the Berkeley Hills and are outside walking your dog. Abrupt strong earthquake shaking commences. Which is the best course of action? Not vet answered Select one:...
You live in the Berkeley Hills and are outside walking your dog.
Abrupt strong earthquake shaking commences. Which is the best
course of action?
Earthquake warning systems will provide about 10-15 seconds of
warning on average for Bay Area residents. The size of the
time warning window depends on:
Question 21 You live in the Berkeley Hills and are outside walking your dog. Abrupt strong earthquake shaking commences. Which is the best course of action? Not vet answered Select one:...
 EXERCISE 11,4 Locating an Earthquakes Epicenter and Determining When It Occurred (continued) Name Course Section: Date: Arrival times and delays between seismic waves Boston Los Angeles Seattle Selmic wave arrival times Delays between seismic waves S-P Step 3: Estimating Distance from the Epicenter to Each Station Using the Travel-Time Diagram The next figure in this exercise shows how to use seismic wave delay data and the travel time diagram to measure the distance from each station to the epicenter. Start...
 Alpine-Himalayan Ocean Paoiño Ocean Ocean Deep eartho EXERCISE 16.2 Locating Earthquake Epicenters Name: Course Section: Date: This exercise leads you through the reasoning used to calculate the distance from a seismic station to epicenter. But instead of two different seismic waves, let's see first how this works with two cars that start along a road at exactly the same time (see the figure on the next page). Both use cruise control set at 1 mile per minute (60 miles per...
 You live in the Berkeley Hills and are outside walking your dog.
Abrupt strong earthquake shaking commences. Which is the best
course of action?
Earthquake warning systems will provide about 10-15 seconds of
warning on average for Bay Area residents. The size of the
time warning window depends on:
Question 21 You live in the Berkeley Hills and are outside walking your dog. Abrupt strong earthquake shaking commences. Which is the best course of action? Not vet answered Select one:...
You live in the Berkeley Hills and are outside walking your dog.
Abrupt strong earthquake shaking commences. Which is the best
course of action?
Earthquake warning systems will provide about 10-15 seconds of
warning on average for Bay Area residents. The size of the
time warning window depends on:
Question 21 You live in the Berkeley Hills and are outside walking your dog. Abrupt strong earthquake shaking commences. Which is the best course of action? Not vet answered Select one:...
Most questions answered within 3 hours.
-
2) You are given the task of finding a representation for a
circle in a drawing...
asked 19 minutes ago -
STUDY QUESTION: Does use of diet drug fen-phen
(fenfluramine-phentermine) cause valvular heart disease?
HINT: Valvular heart...
asked 10 minutes ago -
1. An object weighing 40 N rests on a surface. The coefficient
of friction is 0.35....
asked 1 hour ago -
Investor company owns 35% of investee company voting stock and
accounts for the investment under the...
asked 2 hours ago -
The number of major faults on a randomly chosen 1 km stretch of
highway has a...
asked 2 hours ago -
Consider the competitive environment of Starbuck's, Progressive
Insurance, a manufacturing firm with low turnover, or a...
asked 3 hours ago -
3. Gains from trade
Consider two neighbouring island countries called Euphoria and
Contente. They each have...
asked 5 hours ago -
A business executive has the option to invest money in two
plans: Plan A guarantees that...
asked 7 hours ago -
Hello, can someone please help me answer this question?
How much heat is absorbed by a...
asked 7 hours ago -
. A marketing researcher conducted a survey of 25 shoppers
randomly selected at the local mall...
asked 8 hours ago -
Create an comprehensive response to the
following:
Antimicrobial agents work on a multitude of microbes (bacteria,...
asked 8 hours ago -
6.13 LAB: Step counter. Section 6.3.
A pedometer treats walking 2,000 steps as walking 1 mile....
asked 8 hours ago