


Homework Answers

Add Answer to:
IR of Synthesized Acetaminophen - Use the IR spectrum of your synthesized acetaminophen to answer the...
pls interpret and analyze both IR Spectrum . thanks philip/johnson 105 100 95 90- 85 80 75 70 65 60 55 50- 45- 50...
 pls interpret and analyze both IR Spectrum . thanks
philip/johnson 105 100 95 90- 85 80 75 70 65 60 55 50- 45- 500 1000 1500 2000 2500 3500 3000 4000 Wavenumbers (om-1) %Transmittance 100 philipljphnson 95- 85 80 75 70- 65- 60 55 50 4000 3500 1000 500 3000 1500 2500 2000 %Transmittance 90
philip/johnson 105 100 95 90- 85 80 75 70 65 60 55 50- 45- 500 1000 1500 2000 2500 3500 3000 4000 Wavenumbers (om-1) %Transmittance...
pls interpret and analyze both IR Spectrum . thanks
philip/johnson 105 100 95 90- 85 80 75 70 65 60 55 50- 45- 500 1000 1500 2000 2500 3500 3000 4000 Wavenumbers (om-1) %Transmittance 100 philipljphnson 95- 85 80 75 70- 65- 60 55 50 4000 3500 1000 500 3000 1500 2500 2000 %Transmittance 90
philip/johnson 105 100 95 90- 85 80 75 70 65 60 55 50- 45- 500 1000 1500 2000 2500 3500 3000 4000 Wavenumbers (om-1) %Transmittance...
Does your IR spectrum indicate that the starting material was acetylated ? Briefly explain. Transmittance 0...
 Does your IR spectrum indicate that the starting material was
acetylated ? Briefly explain.
Transmittance 0 4000 3500 3000 2500 Wavenumbers (cm-1) 2000 1500 1000
Does your IR spectrum indicate that the starting material was
acetylated ? Briefly explain.
Transmittance 0 4000 3500 3000 2500 Wavenumbers (cm-1) 2000 1500 1000
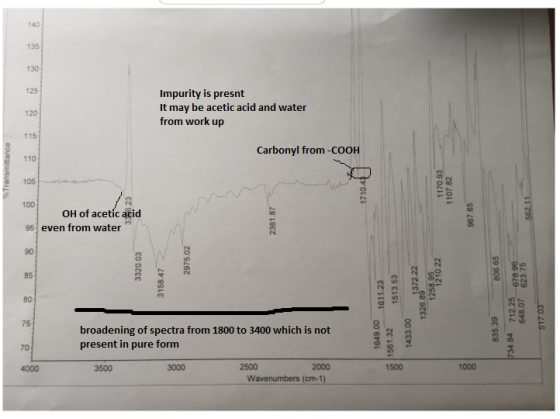
Please evaluate the IR spectrum. Provide a structure and note any important peaks corresponding to the structure. It was an experiment using: isoamyl alcohol + acetic acid sulfuric acid as the catalys...
 Please evaluate the IR spectrum. Provide a structure and note
any important peaks corresponding to the structure.
It was an experiment using:
isoamyl alcohol + acetic acid
sulfuric acid as the catalyst
and the products are isoamyl acetate and water. Thank you so
much!!!
95 卜诒 卜” 90 85 寸 80 75 70 65 E 60 ー 55 50 45 40 35 30 25 20 4000 3500 3000 2500 2000 Wavenumbers (cm-1) 1500 1000 500
95 卜诒 卜” 90 85...
Please evaluate the IR spectrum. Provide a structure and note
any important peaks corresponding to the structure.
It was an experiment using:
isoamyl alcohol + acetic acid
sulfuric acid as the catalyst
and the products are isoamyl acetate and water. Thank you so
much!!!
95 卜诒 卜” 90 85 寸 80 75 70 65 E 60 ー 55 50 45 40 35 30 25 20 4000 3500 3000 2500 2000 Wavenumbers (cm-1) 1500 1000 500
95 卜诒 卜” 90 85...
please help me analyze the IR of these three compounds. The first one is M-nitrophenol, the...
 please help me analyze the IR of these three compounds. The first
one is M-nitrophenol, the second one is M-xylene, and the third one
is toluene.
m-Nitrophenol BRUKER 95 90 85 80 Transmittance [%] 75 70 65 60 1500 1000 3000 3500 2500 2000 Wavenumber cm-1 m-Xylene. 100 RUKER 90 80 70 Transmittance [%] 60 50 40 30 1500 1000 3500 3000 2500 2000 Wavenumber cm-1 Toluene བཟའགུལྡན Transmittance [%] 203040 50 60708090 100 ༢500 ༢000 3500 3000 2500 2000...
please help me analyze the IR of these three compounds. The first
one is M-nitrophenol, the second one is M-xylene, and the third one
is toluene.
m-Nitrophenol BRUKER 95 90 85 80 Transmittance [%] 75 70 65 60 1500 1000 3000 3500 2500 2000 Wavenumber cm-1 m-Xylene. 100 RUKER 90 80 70 Transmittance [%] 60 50 40 30 1500 1000 3500 3000 2500 2000 Wavenumber cm-1 Toluene བཟའགུལྡན Transmittance [%] 203040 50 60708090 100 ༢500 ༢000 3500 3000 2500 2000...
please analyze this spectrum stating the functional groups present and their corresponding wavenumbers and band strength...
 please analyze this spectrum stating the functional groups
present and their corresponding wavenumbers and band strength
100 BRUKER 06 80 70 Transmittance [%] 09 50 IR Spectrum of Ethyl Trans- Cinnamate from Wittig Reaction 40 கக்ககம் SO88888888949889878888888 B&&&& 3500 3000 1500 1000 500 2500 2000 JALNumborem.
please analyze this spectrum stating the functional groups
present and their corresponding wavenumbers and band strength
100 BRUKER 06 80 70 Transmittance [%] 09 50 IR Spectrum of Ethyl Trans- Cinnamate from Wittig Reaction 40 கக்ககம் SO88888888949889878888888 B&&&& 3500 3000 1500 1000 500 2500 2000 JALNumborem.
Interpret the IR spectrum for benzoin. Draw out each compound on the corresponding spectrum and indicate...
 Interpret the IR spectrum for benzoin. Draw out each
compound on the corresponding spectrum and indicate the specific
absorbance (not the ranges from the correlation table) for each
type of bond.Some of the hydrogen-bonding groups display sharper
than normal absorbance. Explain why.
(GMT-07 00) 90 85 80 75 70 65 60 50 1500 1000 2500 2000 4000 3500 Wavenumbers (cm-1)
Interpret the IR spectrum for benzoin. Draw out each
compound on the corresponding spectrum and indicate the specific
absorbance (not the ranges from the correlation table) for each
type of bond.Some of the hydrogen-bonding groups display sharper
than normal absorbance. Explain why.
(GMT-07 00) 90 85 80 75 70 65 60 50 1500 1000 2500 2000 4000 3500 Wavenumbers (cm-1)
Identify the peaks that identify the functional groups in the IR spectrum Unknown 4 C2H60 TRANSMITTANCE...
 Identify the peaks that identify the functional groups
in the IR spectrum
Unknown 4 C2H60 TRANSMITTANCE 1001- 0 900- 0 800- 0.700- 0.600- 0.500- 0.400- 0.300- 0200- 0.100- 0.000- 4000 IR Unknown 3500 3000 2500 2000 1000 1500 Load IR spectrum Load proton NMR Show structure Spectra are displayed using JSpecView Website maintained by Jennifer Muzyka Contact me at jennifer muzyka@centre edu. Unknown 5 C3H5NO TRANSMITTANCE 1.001 - 0.900- 0800- 0.700- 0.600- 0.500- 0.400- 0.300- 0 200- 0.100- 0 000...
Identify the peaks that identify the functional groups
in the IR spectrum
Unknown 4 C2H60 TRANSMITTANCE 1001- 0 900- 0 800- 0.700- 0.600- 0.500- 0.400- 0.300- 0200- 0.100- 0.000- 4000 IR Unknown 3500 3000 2500 2000 1000 1500 Load IR spectrum Load proton NMR Show structure Spectra are displayed using JSpecView Website maintained by Jennifer Muzyka Contact me at jennifer muzyka@centre edu. Unknown 5 C3H5NO TRANSMITTANCE 1.001 - 0.900- 0800- 0.700- 0.600- 0.500- 0.400- 0.300- 0 200- 0.100- 0 000...
Draw the correct structure for C8H8 by analyzing the spectra below. Label the spectrum and explain...
 Draw the correct structure for C8H8 by analyzing the spectra
below. Label the spectrum and explain your answer.
100 95 90 85 80 75 70 65 60 55 50 45 4000 3500 3000 2500 1500 1000 2000 500 Wavenumbers (cm-1) %Transmittance 2973.42 2940.13 2826.86 1469.79 1386.26 1363.07 1262.57 1020.89 850.92 724.39 459.11 4.5 3.5 3.0 4.0 2.5 2.0 0.5 ppm 1.5 1.0 00 3.04
Draw the correct structure for C8H8 by analyzing the spectra
below. Label the spectrum and explain your answer.
100 95 90 85 80 75 70 65 60 55 50 45 4000 3500 3000 2500 1500 1000 2000 500 Wavenumbers (cm-1) %Transmittance 2973.42 2940.13 2826.86 1469.79 1386.26 1363.07 1262.57 1020.89 850.92 724.39 459.11 4.5 3.5 3.0 4.0 2.5 2.0 0.5 ppm 1.5 1.0 00 3.04
Interpret the IR spectrum. Assign peaks to the major functional groups present in Compound 3. %Transmittance...
 Interpret the IR spectrum. Assign peaks to the major
functional groups present in Compound 3.
%Transmittance 4000 451 3500 3000 2500 Wavenumbers (cm-1) 2000 1704.22 1582.94 1500 1455.74 1401.84 1360.52 1277.77 1199.79 1169,80 1000 1149.01 1090.22 1008 96 1024.98 COMPOUND 3 942.39 919 35 885.89 855.60 780.62 714.49
Interpret the IR spectrum. Assign peaks to the major
functional groups present in Compound 3.
%Transmittance 4000 451 3500 3000 2500 Wavenumbers (cm-1) 2000 1704.22 1582.94 1500 1455.74 1401.84 1360.52 1277.77 1199.79 1169,80 1000 1149.01 1090.22 1008 96 1024.98 COMPOUND 3 942.39 919 35 885.89 855.60 780.62 714.49
analyze the following IR spectrum 20 30 40 Transmittance [%] 50 60 70 80 90 8...
 analyze the following IR spectrum
20 30 40 Transmittance [%] 50 60 70 80 90 8 BRUKER 3500 3320.11 3158.60 3000 2792.90 2587.95 249390 2500 Wavenumber cm-1 2000 1876.76 1500 1000 8888888889143888888 500
analyze the following IR spectrum
20 30 40 Transmittance [%] 50 60 70 80 90 8 BRUKER 3500 3320.11 3158.60 3000 2792.90 2587.95 249390 2500 Wavenumber cm-1 2000 1876.76 1500 1000 8888888889143888888 500
 pls interpret and analyze both IR Spectrum . thanks
philip/johnson 105 100 95 90- 85 80 75 70 65 60 55 50- 45- 500 1000 1500 2000 2500 3500 3000 4000 Wavenumbers (om-1) %Transmittance 100 philipljphnson 95- 85 80 75 70- 65- 60 55 50 4000 3500 1000 500 3000 1500 2500 2000 %Transmittance 90
philip/johnson 105 100 95 90- 85 80 75 70 65 60 55 50- 45- 500 1000 1500 2000 2500 3500 3000 4000 Wavenumbers (om-1) %Transmittance...
pls interpret and analyze both IR Spectrum . thanks
philip/johnson 105 100 95 90- 85 80 75 70 65 60 55 50- 45- 500 1000 1500 2000 2500 3500 3000 4000 Wavenumbers (om-1) %Transmittance 100 philipljphnson 95- 85 80 75 70- 65- 60 55 50 4000 3500 1000 500 3000 1500 2500 2000 %Transmittance 90
philip/johnson 105 100 95 90- 85 80 75 70 65 60 55 50- 45- 500 1000 1500 2000 2500 3500 3000 4000 Wavenumbers (om-1) %Transmittance...
 Does your IR spectrum indicate that the starting material was
acetylated ? Briefly explain.
Transmittance 0 4000 3500 3000 2500 Wavenumbers (cm-1) 2000 1500 1000
Does your IR spectrum indicate that the starting material was
acetylated ? Briefly explain.
Transmittance 0 4000 3500 3000 2500 Wavenumbers (cm-1) 2000 1500 1000
 Please evaluate the IR spectrum. Provide a structure and note
any important peaks corresponding to the structure.
It was an experiment using:
isoamyl alcohol + acetic acid
sulfuric acid as the catalyst
and the products are isoamyl acetate and water. Thank you so
much!!!
95 卜诒 卜” 90 85 寸 80 75 70 65 E 60 ー 55 50 45 40 35 30 25 20 4000 3500 3000 2500 2000 Wavenumbers (cm-1) 1500 1000 500
95 卜诒 卜” 90 85...
Please evaluate the IR spectrum. Provide a structure and note
any important peaks corresponding to the structure.
It was an experiment using:
isoamyl alcohol + acetic acid
sulfuric acid as the catalyst
and the products are isoamyl acetate and water. Thank you so
much!!!
95 卜诒 卜” 90 85 寸 80 75 70 65 E 60 ー 55 50 45 40 35 30 25 20 4000 3500 3000 2500 2000 Wavenumbers (cm-1) 1500 1000 500
95 卜诒 卜” 90 85...
 please help me analyze the IR of these three compounds. The first
one is M-nitrophenol, the second one is M-xylene, and the third one
is toluene.
m-Nitrophenol BRUKER 95 90 85 80 Transmittance [%] 75 70 65 60 1500 1000 3000 3500 2500 2000 Wavenumber cm-1 m-Xylene. 100 RUKER 90 80 70 Transmittance [%] 60 50 40 30 1500 1000 3500 3000 2500 2000 Wavenumber cm-1 Toluene བཟའགུལྡན Transmittance [%] 203040 50 60708090 100 ༢500 ༢000 3500 3000 2500 2000...
please help me analyze the IR of these three compounds. The first
one is M-nitrophenol, the second one is M-xylene, and the third one
is toluene.
m-Nitrophenol BRUKER 95 90 85 80 Transmittance [%] 75 70 65 60 1500 1000 3000 3500 2500 2000 Wavenumber cm-1 m-Xylene. 100 RUKER 90 80 70 Transmittance [%] 60 50 40 30 1500 1000 3500 3000 2500 2000 Wavenumber cm-1 Toluene བཟའགུལྡན Transmittance [%] 203040 50 60708090 100 ༢500 ༢000 3500 3000 2500 2000...
 please analyze this spectrum stating the functional groups
present and their corresponding wavenumbers and band strength
100 BRUKER 06 80 70 Transmittance [%] 09 50 IR Spectrum of Ethyl Trans- Cinnamate from Wittig Reaction 40 கக்ககம் SO88888888949889878888888 B&&&& 3500 3000 1500 1000 500 2500 2000 JALNumborem.
please analyze this spectrum stating the functional groups
present and their corresponding wavenumbers and band strength
100 BRUKER 06 80 70 Transmittance [%] 09 50 IR Spectrum of Ethyl Trans- Cinnamate from Wittig Reaction 40 கக்ககம் SO88888888949889878888888 B&&&& 3500 3000 1500 1000 500 2500 2000 JALNumborem.
 Interpret the IR spectrum for benzoin. Draw out each
compound on the corresponding spectrum and indicate the specific
absorbance (not the ranges from the correlation table) for each
type of bond.Some of the hydrogen-bonding groups display sharper
than normal absorbance. Explain why.
(GMT-07 00) 90 85 80 75 70 65 60 50 1500 1000 2500 2000 4000 3500 Wavenumbers (cm-1)
Interpret the IR spectrum for benzoin. Draw out each
compound on the corresponding spectrum and indicate the specific
absorbance (not the ranges from the correlation table) for each
type of bond.Some of the hydrogen-bonding groups display sharper
than normal absorbance. Explain why.
(GMT-07 00) 90 85 80 75 70 65 60 50 1500 1000 2500 2000 4000 3500 Wavenumbers (cm-1)
 Identify the peaks that identify the functional groups
in the IR spectrum
Unknown 4 C2H60 TRANSMITTANCE 1001- 0 900- 0 800- 0.700- 0.600- 0.500- 0.400- 0.300- 0200- 0.100- 0.000- 4000 IR Unknown 3500 3000 2500 2000 1000 1500 Load IR spectrum Load proton NMR Show structure Spectra are displayed using JSpecView Website maintained by Jennifer Muzyka Contact me at jennifer muzyka@centre edu. Unknown 5 C3H5NO TRANSMITTANCE 1.001 - 0.900- 0800- 0.700- 0.600- 0.500- 0.400- 0.300- 0 200- 0.100- 0 000...
Identify the peaks that identify the functional groups
in the IR spectrum
Unknown 4 C2H60 TRANSMITTANCE 1001- 0 900- 0 800- 0.700- 0.600- 0.500- 0.400- 0.300- 0200- 0.100- 0.000- 4000 IR Unknown 3500 3000 2500 2000 1000 1500 Load IR spectrum Load proton NMR Show structure Spectra are displayed using JSpecView Website maintained by Jennifer Muzyka Contact me at jennifer muzyka@centre edu. Unknown 5 C3H5NO TRANSMITTANCE 1.001 - 0.900- 0800- 0.700- 0.600- 0.500- 0.400- 0.300- 0 200- 0.100- 0 000...
 Draw the correct structure for C8H8 by analyzing the spectra
below. Label the spectrum and explain your answer.
100 95 90 85 80 75 70 65 60 55 50 45 4000 3500 3000 2500 1500 1000 2000 500 Wavenumbers (cm-1) %Transmittance 2973.42 2940.13 2826.86 1469.79 1386.26 1363.07 1262.57 1020.89 850.92 724.39 459.11 4.5 3.5 3.0 4.0 2.5 2.0 0.5 ppm 1.5 1.0 00 3.04
Draw the correct structure for C8H8 by analyzing the spectra
below. Label the spectrum and explain your answer.
100 95 90 85 80 75 70 65 60 55 50 45 4000 3500 3000 2500 1500 1000 2000 500 Wavenumbers (cm-1) %Transmittance 2973.42 2940.13 2826.86 1469.79 1386.26 1363.07 1262.57 1020.89 850.92 724.39 459.11 4.5 3.5 3.0 4.0 2.5 2.0 0.5 ppm 1.5 1.0 00 3.04
 Interpret the IR spectrum. Assign peaks to the major
functional groups present in Compound 3.
%Transmittance 4000 451 3500 3000 2500 Wavenumbers (cm-1) 2000 1704.22 1582.94 1500 1455.74 1401.84 1360.52 1277.77 1199.79 1169,80 1000 1149.01 1090.22 1008 96 1024.98 COMPOUND 3 942.39 919 35 885.89 855.60 780.62 714.49
Interpret the IR spectrum. Assign peaks to the major
functional groups present in Compound 3.
%Transmittance 4000 451 3500 3000 2500 Wavenumbers (cm-1) 2000 1704.22 1582.94 1500 1455.74 1401.84 1360.52 1277.77 1199.79 1169,80 1000 1149.01 1090.22 1008 96 1024.98 COMPOUND 3 942.39 919 35 885.89 855.60 780.62 714.49
 analyze the following IR spectrum
20 30 40 Transmittance [%] 50 60 70 80 90 8 BRUKER 3500 3320.11 3158.60 3000 2792.90 2587.95 249390 2500 Wavenumber cm-1 2000 1876.76 1500 1000 8888888889143888888 500
analyze the following IR spectrum
20 30 40 Transmittance [%] 50 60 70 80 90 8 BRUKER 3500 3320.11 3158.60 3000 2792.90 2587.95 249390 2500 Wavenumber cm-1 2000 1876.76 1500 1000 8888888889143888888 500
Most questions answered within 3 hours.
-
In recent years, 80% of those accused of Driving Under the
Influence (DUI) get convicted (includes...
asked 54 seconds ago -
What would the solow growth model look like if there was a
production function which had...
asked 6 minutes ago -
Why does Max Weber distinguish between "power," "authority," and
different types of authority? What is he...
asked 1 minute ago -
A company project has an initial cost of $40,000, expected net
cash flows of $9,000 per...
asked 7 minutes ago -
How do you use strategy in your current position or how does
your current position align...
asked 10 minutes ago -
a person's ability to be properly diagnosed with a
disease/condition can be affected by the person;s...
asked 9 minutes ago -
John needs 40 Eternal Light flashlights. Each Eternal Light
flashlight requires 3 bulbs, and each bulb...
asked 17 minutes ago -
1) If Nominal GDP is $16,000 billion and the GDP deflator is 50,
then Real GDP...
asked 23 minutes ago -
D. A student completed 20 courses in the School of Arts and
Sciences. Her grades in...
asked 2 hours ago -
teo
pucks moving on a frictionless air table are about to collide. the
1.5 kg puck...
asked 2 hours ago -
Problem #1
The area between Z = 0 and Z = 2.50
The area between Z...
asked 3 hours ago -
1. What is the meaning of the term communication style?
2. What are the benefits to...
asked 3 hours ago