

Part ll: Analysis of Data Applying Integrals Calculating total change (distance traveled) of the aircraft. Using the data in Table I, use a right-endpoint estimate to calculate the distance traveled by the aircraft from t 0 to t 45 seconds Using the data in Table I, use a left-endpoint estimate to calculate the distance (total change) traveled by the aircraft from t 0 to t 45 seconds. Find the best estimate for the distance traveled by the aircraft from t 0 to t 45 seconds. A. 1 2 3 В. Graphing the model. Using the velocity data in Table I, generate a table of estimates that represents the total change of the moving object. Then, use this table of values to graph the model for the velocity function and the distance function. 15 25 30 40 45 tin seconds 10 20 35 v(t) in feet per second 80.80 2.65 274.27 223.19 179.23 141.4 108.83 56.68 35.91 18.04 s(t) C. Discuss the relevance of these graphs, and how the velocity graph is used to find the distance traveled by the aircraft. Discuss the relationship between the two graphs using calculus terminology.
Homework Answers
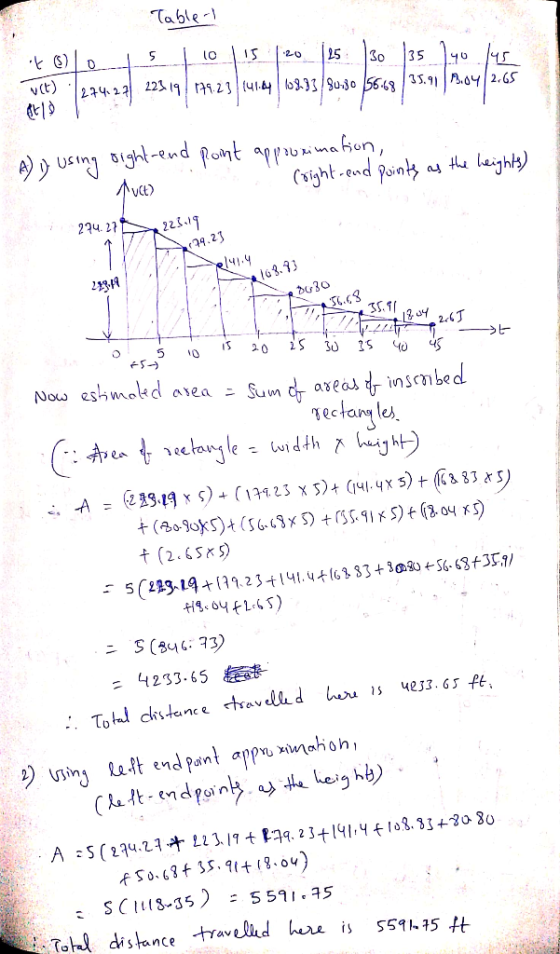


Table t in seconds 0 10 15 25 30 40 45 20 35 v(t) in feet...
 Table t in seconds 0 10 15 25 30 40 45 20 35 v(t) in feet per second 274.27 179.23 141.4 108.83 80.80 56.68 35.91 18.04 2.65 223.19 Table II t in seconds 4. 5 14 15 24 25 34 35 44 45 232.8 v(t) in feet per second 223.19 148.52 39.82 35.91 5.55 141.4 86.08 80.80 2.65 Part IV: Analysis of the Model: Calculate the distance and acceleration using a model rather than data. 1100 462 -0.03t P The...
Table I 25 tin seconds 5 10 15 20 30 35 40 45 v(t) in feet...
 Table I 25 tin seconds 5 10 15 20 30 35 40 45 v(t) in feet per second 274.27 179.23 80.80 56.68 35.91 18.04 2.65 223.19 141.4 108.83 Table I t in seconds 4 24 25 35 45 5 14 15 34 44 v(t) in feet per second 232.8 223.19 141.4 86.08 80.80 39.82 35.91 5.55 2.65 148.52 Analysis of the Model: Calculate the distance and acceleration using a model rather than data. 1100-0.03t 462 The model for this set...
Below is a set of data that represents the velocity (in feet per second) of the final 45 seconds of the landing. At t...
 Below is a set of data that represents the velocity (in feet per second) of the final 45 seconds of the landing. At t 0, the plane is on its final descent. Table I t in seconds 10 20 25 30 45 5 15 35 40 v(t) feet per second 274.27 223.19 179.23 108.83 80.80 56.68 35.91 18.04 2.65 141.4 Table II t in seconds 4 5 14 15 24 25 34 35 44 45 v(t) in feet per second...
Suppose the velocity V in meters per second) of a runner during the first few seconds of e race is given by t ins 0.5 11.5 2 2.5 V in m/s0 4 8.515.119 25 in the tv endpoint approximation and width 0....
 Suppose the velocity V in meters per second) of a runner during the first few seconds of e race is given by t ins 0.5 11.5 2 2.5 V in m/s0 4 8.515.119 25 in the tv endpoint approximation and width 0.5 Plot these points in the plane. Sketch the velccity curve. Estimate the distance traveled by the runner by estimating the area under the velocity curve; use rectangles with heights given by a right endpoint approximation and width plane....
Wind Chill 50 45 40 35 30 Wind Speed (km/h) 25 20 15 10 5 0...
 Wind Chill 50 45 40 35 30 Wind Speed (km/h) 25 20 15 10 5 0 in -10 -15 -20 35 40 -45 -50 Air Temperature (°C) Task: The wind chill index measures the sensation of cold on the human skin. In October 2001, Environment Canada introduced the wind chill index above. Each curve represents the combination of air temperature and wind speed that would produce the given wind chill value. For example, a temperature of -25°C and wind speed...
5a.(20) Answer the following questions based on the v-t diagram for t 0-10 seconds. a. What...
 5a.(20) Answer the following questions based on the v-t diagram for t 0-10 seconds. a. What is the maximum velocity? b. When is the magnitude of the acceleration greatest? 20 10 c.What is the acceleration at t = 1.3 s? t d. At what time(s) is a = 0? 10 5 and t4 seconds? e. What is the approximate distance traveled betweent =_1
0 to 60 mph in 10 seconds with the A car accelerates smoothly from velocity given in the figure below. Estimate how far the car travels during the 10 -second period. v (mph) 60 40 20 t (sec) 10 5 Rou...
 0 to 60 mph in 10 seconds with the A car accelerates smoothly from velocity given in the figure below. Estimate how far the car travels during the 10 -second period. v (mph) 60 40 20 t (sec) 10 5 Round your answer to three decimal places. miles. The car traveled
0 to 60 mph in 10 seconds with the A car accelerates smoothly from velocity given in the figure below. Estimate how far the car travels during the 10...
0 to 60 mph in 10 seconds with the A car accelerates smoothly from velocity given in the figure below. Estimate how far the car travels during the 10 -second period. v (mph) 60 40 20 t (sec) 10 5 Round your answer to three decimal places. miles. The car traveled
0 to 60 mph in 10 seconds with the A car accelerates smoothly from velocity given in the figure below. Estimate how far the car travels during the 10...
Given the following table of velocity data 1, 0 05 10 15 20 25 3.0 3.5...
 Given the following table of velocity data 1, 0 05 10 15 20 25 3.0 3.5 4.0 V m/s 0 12 16 1.4 2.0 2.0 1.8 1.6 1.3 a) Estimate the position of the vehicle at 1.5 seconds, as accurately as possible b) Estimate the acceleration of the vehicle at 1.5 seconds, as accurately as c) Estimate the position of the vehicle at 4 seconds, as accurately as possible d) Estimate the acceleration of the vehicle at 4 seconds, as...
05 0 5 10 15 20 25 30 35 40 45 50 55 0 70 Time (sec) 7. The above figure displays the time respon...
 05 0 5 10 15 20 25 30 35 40 45 50 55 0 70 Time (sec) 7. The above figure displays the time response of a seismometer due to a step input of 0.1 cm. (a) If the system is either first- or second-order system, find the system model? (ustify your results) (b) If the input is 0.5sin0.1t, find the steady state output of the seismometer (c) Determine the useful frequency range of this sensor (+5%)
05 0 5...
05 0 5 10 15 20 25 30 35 40 45 50 55 0 70 Time (sec) 7. The above figure displays the time response of a seismometer due to a step input of 0.1 cm. (a) If the system is either first- or second-order system, find the system model? (ustify your results) (b) If the input is 0.5sin0.1t, find the steady state output of the seismometer (c) Determine the useful frequency range of this sensor (+5%)
05 0 5...
PLEASE HELP 25. The following figure shows the dynamics of a TCP congestion window. (8 points) 45 40 35 s 30 3 25 20 0 2 4 6 8 10 12 14 16 18 20 22 24 26 Transmission round i) What is the initial...
 PLEASE HELP
25. The following figure shows the dynamics of a TCP congestion window. (8 points) 45 40 35 s 30 3 25 20 0 2 4 6 8 10 12 14 16 18 20 22 24 26 Transmission round i) What is the initial threshold? d at the t transmission round that caused the congestion window to change from exponential growh to linear i) What happerned growth? ii) What kind of loss occurred at the 16 transmission round that...
PLEASE HELP
25. The following figure shows the dynamics of a TCP congestion window. (8 points) 45 40 35 s 30 3 25 20 0 2 4 6 8 10 12 14 16 18 20 22 24 26 Transmission round i) What is the initial threshold? d at the t transmission round that caused the congestion window to change from exponential growh to linear i) What happerned growth? ii) What kind of loss occurred at the 16 transmission round that...
 Table t in seconds 0 10 15 25 30 40 45 20 35 v(t) in feet per second 274.27 179.23 141.4 108.83 80.80 56.68 35.91 18.04 2.65 223.19 Table II t in seconds 4. 5 14 15 24 25 34 35 44 45 232.8 v(t) in feet per second 223.19 148.52 39.82 35.91 5.55 141.4 86.08 80.80 2.65 Part IV: Analysis of the Model: Calculate the distance and acceleration using a model rather than data. 1100 462 -0.03t P The...
 Table I 25 tin seconds 5 10 15 20 30 35 40 45 v(t) in feet per second 274.27 179.23 80.80 56.68 35.91 18.04 2.65 223.19 141.4 108.83 Table I t in seconds 4 24 25 35 45 5 14 15 34 44 v(t) in feet per second 232.8 223.19 141.4 86.08 80.80 39.82 35.91 5.55 2.65 148.52 Analysis of the Model: Calculate the distance and acceleration using a model rather than data. 1100-0.03t 462 The model for this set...
 Below is a set of data that represents the velocity (in feet per second) of the final 45 seconds of the landing. At t 0, the plane is on its final descent. Table I t in seconds 10 20 25 30 45 5 15 35 40 v(t) feet per second 274.27 223.19 179.23 108.83 80.80 56.68 35.91 18.04 2.65 141.4 Table II t in seconds 4 5 14 15 24 25 34 35 44 45 v(t) in feet per second...
 Suppose the velocity V in meters per second) of a runner during the first few seconds of e race is given by t ins 0.5 11.5 2 2.5 V in m/s0 4 8.515.119 25 in the tv endpoint approximation and width 0.5 Plot these points in the plane. Sketch the velccity curve. Estimate the distance traveled by the runner by estimating the area under the velocity curve; use rectangles with heights given by a right endpoint approximation and width plane....
 Wind Chill 50 45 40 35 30 Wind Speed (km/h) 25 20 15 10 5 0 in -10 -15 -20 35 40 -45 -50 Air Temperature (°C) Task: The wind chill index measures the sensation of cold on the human skin. In October 2001, Environment Canada introduced the wind chill index above. Each curve represents the combination of air temperature and wind speed that would produce the given wind chill value. For example, a temperature of -25°C and wind speed...
 5a.(20) Answer the following questions based on the v-t diagram for t 0-10 seconds. a. What is the maximum velocity? b. When is the magnitude of the acceleration greatest? 20 10 c.What is the acceleration at t = 1.3 s? t d. At what time(s) is a = 0? 10 5 and t4 seconds? e. What is the approximate distance traveled betweent =_1
 0 to 60 mph in 10 seconds with the A car accelerates smoothly from velocity given in the figure below. Estimate how far the car travels during the 10 -second period. v (mph) 60 40 20 t (sec) 10 5 Round your answer to three decimal places. miles. The car traveled
0 to 60 mph in 10 seconds with the A car accelerates smoothly from velocity given in the figure below. Estimate how far the car travels during the 10...
0 to 60 mph in 10 seconds with the A car accelerates smoothly from velocity given in the figure below. Estimate how far the car travels during the 10 -second period. v (mph) 60 40 20 t (sec) 10 5 Round your answer to three decimal places. miles. The car traveled
0 to 60 mph in 10 seconds with the A car accelerates smoothly from velocity given in the figure below. Estimate how far the car travels during the 10...
 Given the following table of velocity data 1, 0 05 10 15 20 25 3.0 3.5 4.0 V m/s 0 12 16 1.4 2.0 2.0 1.8 1.6 1.3 a) Estimate the position of the vehicle at 1.5 seconds, as accurately as possible b) Estimate the acceleration of the vehicle at 1.5 seconds, as accurately as c) Estimate the position of the vehicle at 4 seconds, as accurately as possible d) Estimate the acceleration of the vehicle at 4 seconds, as...
 05 0 5 10 15 20 25 30 35 40 45 50 55 0 70 Time (sec) 7. The above figure displays the time response of a seismometer due to a step input of 0.1 cm. (a) If the system is either first- or second-order system, find the system model? (ustify your results) (b) If the input is 0.5sin0.1t, find the steady state output of the seismometer (c) Determine the useful frequency range of this sensor (+5%)
05 0 5...
05 0 5 10 15 20 25 30 35 40 45 50 55 0 70 Time (sec) 7. The above figure displays the time response of a seismometer due to a step input of 0.1 cm. (a) If the system is either first- or second-order system, find the system model? (ustify your results) (b) If the input is 0.5sin0.1t, find the steady state output of the seismometer (c) Determine the useful frequency range of this sensor (+5%)
05 0 5...
 PLEASE HELP
25. The following figure shows the dynamics of a TCP congestion window. (8 points) 45 40 35 s 30 3 25 20 0 2 4 6 8 10 12 14 16 18 20 22 24 26 Transmission round i) What is the initial threshold? d at the t transmission round that caused the congestion window to change from exponential growh to linear i) What happerned growth? ii) What kind of loss occurred at the 16 transmission round that...
PLEASE HELP
25. The following figure shows the dynamics of a TCP congestion window. (8 points) 45 40 35 s 30 3 25 20 0 2 4 6 8 10 12 14 16 18 20 22 24 26 Transmission round i) What is the initial threshold? d at the t transmission round that caused the congestion window to change from exponential growh to linear i) What happerned growth? ii) What kind of loss occurred at the 16 transmission round that...
Most questions answered within 3 hours.
-
Two particles each have a rest mass energy of 30 MeV and are
traveling with a...
asked 1 hour ago -
why
is vectorization a faster alternative to loops?
asked 2 hours ago -
General Matter’s outstanding bond issue has a coupon rate of
11.8%, and it sells at a...
asked 3 hours ago -
Write a one page essay on how important is it to know your basic
accounting knowledge...
asked 3 hours ago -
You are a Senior Civil Engineer posted at the Contracts and
Procurement Division of the Ministry...
asked 3 hours ago -
When using the percentage of completion method, the
company
- recognizes revenues and gross profit each...
asked 3 hours ago -
Is a level production strategy suitable for a pure service
industry, such as professional accounting and...
asked 3 hours ago -
Baker Industries’ net income is $23000, its interest expense is
$4000, and its tax rate is...
asked 3 hours ago -
a) A proton moves at 500 m/s in a 2 T magnetic field. What is
the...
asked 3 hours ago -
Anderson Systems is considering a project that has the following
cash flow and WACC data. What...
asked 4 hours ago -
MARIE Assembly Code Problem
For the following problem, please create new MARIE instructions
by providing the...
asked 3 hours ago -
Which ligands are similar to each other in how they bind to
metals?
A) methyl, amine,...
asked 3 hours ago