


Homework Answers

Add Answer to:
Statement of Cash Flows-Indirect Method The comparative balance sheet of Harris Industries Inc. at December 31,...
The comparative balance sheet of Harris Industries Inc. at December 31, 20Y4 and 20Y3, is as follows: An examinatio...
 The comparative balance sheet of Harris Industries Inc. at December
31, 20Y4 and 20Y3, is as follows:
An examination of the income
statement and the accounting records revealed the following
additional information applicable to 20Y4:
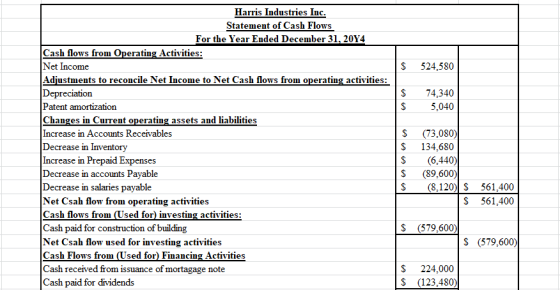
Net income, $524,580.
Depreciation expense reported on
the income statement: buildings, $51,660; machinery and equipment,
$22,680.
Patent amortization reported on the
income statement, $5,040.
A building was constructed for
$579,600.
A mortgage note for $224,000 was
issued for cash.
30,000 shares of common stock were...
The comparative balance sheet of Harris Industries Inc. at December
31, 20Y4 and 20Y3, is as follows:
An examination of the income
statement and the accounting records revealed the following
additional information applicable to 20Y4:
Net income, $524,580.
Depreciation expense reported on
the income statement: buildings, $51,660; machinery and equipment,
$22,680.
Patent amortization reported on the
income statement, $5,040.
A building was constructed for
$579,600.
A mortgage note for $224,000 was
issued for cash.
30,000 shares of common stock were...
Statement of Cash Flows—Indirect Method The comparative balance sheet of Yellow Dog Enterprises Inc. at December...
Statement of Cash Flows—Indirect Method The comparative balance sheet of Yellow Dog Enterprises Inc. at December 31, 20Y8 and 20Y7, is as follows: Dec. 31, 20Y8 Dec. 31, 20Y7 Assets Cash $69,770 $85,140 Accounts receivable (net) 107,210 114,780 Inventories 153,140 142,260 Prepaid expenses 6,240 4,310 Equipment 311,980 254,890 Accumulated depreciation-equipment (81,110) (62,510) Total assets $567,230 $538,870 Liabilities and Stockholders' Equity Accounts payable (merchandise creditors) $119,120 $112,620 Mortgage note payable 0 161,660 Common stock, $1 par 18,000 11,000 Paid-in capital in...
Statement of Cash Flows—Indirect Method The comparative balance sheet of Olson-Jones Industries Inc. for December 31,...
Statement of Cash Flows—Indirect Method The comparative balance sheet of Olson-Jones Industries Inc. for December 31, 20Y2 and 20Y1, is as follows: Dec. 31, 20Y2 Dec. 31, 20Y1 Assets Cash $183 $14 Accounts receivable (net) 55 49 Inventories 117 99 Land 250 330 Equipment 205 175 Accumulated depreciation—equipment (68) (42) Total assets $742 $625 Liabilities and Stockholders' Equity Accounts payable (merchandise creditors) $51 $37 Dividends payable 5 - Common stock, $1 par 125 80 Paid-in capital in excess of par—common...
Statement of Cash Flows-Indirect Method The comparative balance sheet of Olson-Jones Industries Inc. for December 31,...
 Statement of Cash Flows-Indirect Method The comparative balance sheet of Olson-Jones Industries Inc. for December 31, 2012 and 2041, is as follows: Dec. 31, 2012 Dec. 31, 2011 Assets Cash $183 o Accounts receivable (net) Inventories o Land 250 o on (68) $742 (42) $625 Equipment Accumulated depreciation equipment Total assets Liabilities and Stockholders' Equity Accounts payable (merchandise creditors) Dividends payable Common stock, $1 par Paid-in capital: Excess of issue price over par- common stock Retained earnings u un u...
Statement of Cash Flows-Indirect Method The comparative balance sheet of Olson-Jones Industries Inc. for December 31,...
 Statement of Cash Flows-Indirect Method The comparative balance sheet of Olson-Jones Industries Inc. for December 31, 20Y2 and 2041, is as follows: Dec. 31, Dec. 31, 2012 2011 Assets $155 Cash Accounts receivable (net) Inventories U Land Equipment Accumulated depreciation equipment (19) (10) Total Assets $476 $343 Liabilities and Stockholders' Equity Accounts payable (merchandise creditors) Dividends payable Common stock, $1 par Paid-in capital: Excess of issue price over par- common stock Retained earnings 236 307 $476 Total liabilities and stockholders'...
Statement of Cash Flows—Indirect Method The comparative balance sheet of Olson-Jones Industries Inc. for December 31,...
Statement of Cash Flows—Indirect Method The comparative balance sheet of Olson-Jones Industries Inc. for December 31, 20Y2 and 20Y1, is as follows: Dec. 31, 20Y2 Dec. 31, 20Y1 Assets Cash $185 $60 Accounts receivable (net) 105 75 Inventories 66 41 Land 151 169 Equipment 85 65 Accumulated depreciation-equipment (23) (12) Total Assets $569 $398 Liabilities and Stockholders' Equity Accounts payable (merchandise creditors) $72 $60 Dividends payable 11 - Common stock, $1 par 38 19 Paid-in capital: Excess of issue price...
Statement of Cash Flows—Indirect Method The comparative balance sheet of Olson-Jones Industries Inc. for December 31,...
Statement of Cash Flows—Indirect Method The comparative balance sheet of Olson-Jones Industries Inc. for December 31, 20Y2 and 20Y1, is as follows: Dec. 31, 20Y2 Dec. 31, 20Y1 Assets Cash $136 $44 Accounts receivable (net) 78 55 Inventories 49 30 Land 112 127 Equipment 63 48 Accumulated depreciation-equipment (17) (9) Total Assets $421 $295 Liabilities and Stockholders' Equity Accounts payable (merchandise creditors) $53 $44 Dividends payable 8 - Common stock, $1 par 28 14 Paid-in capital: Excess of issue price...
Statement of Cash Flows-Indirect Method The comparative balance sheet of Olson-Jones Industries Inc. for December 31,...
 Statement of Cash Flows-Indirect Method The comparative balance sheet of Olson-Jones Industries Inc. for December 31, 20Y2 and 2041, is as follows: Dec. 31, 20Y2 Dec. 31, 20Y1 Assets Cash $128 Accounts receivable (net) Inventories Land Equipment Accumulated depreciation-equipment (16) Total Assets $395 $269 Liabilities and Stockholders' Equity Accounts payable (merchandise creditors) Dividends payable Common stock, $1 par Paid-in capital: Excess of issue price over par- common stock Retained earnings 244 Total liabilities and stockholders' equity $395 The following additional...
Statement of Cash Flows—Indirect Method The comparative balance sheet of Livers Inc. for December 31, 20Y3...
Statement of Cash Flows—Indirect Method The comparative balance sheet of Livers Inc. for December 31, 20Y3 and 20Y2, is shown as follows: Dec. 31, 20Y3 Dec. 31, 20Y2 Assets Cash $253,630 $237,840 Accounts receivable (net) 91,880 85,420 Inventories 259,370 252,910 Investments 0 97,980 Land 133,030 0 Equipment 286,170 223,600 Accumulated depreciation—equipment (67,000) (60,300) Total assets $957,080 $837,450 Liabilities and Stockholders' Equity Accounts payable (merchandise creditors) $173,230 $164,980 Accrued expenses payable (operating expenses) 17,230 21,770 Dividends payable 9,570 7,540 Common stock,...
Statement of Cash Flows Indirect Method The comparative balance sheet of Luciano Company for the year ended December 31, 2016 and 2015, is as follows
Dec. 31, 2015 Dec. 2016 ASSETSCash ...
 The comparative balance sheet of Harris Industries Inc. at December
31, 20Y4 and 20Y3, is as follows:
An examination of the income
statement and the accounting records revealed the following
additional information applicable to 20Y4:
Net income, $524,580.
Depreciation expense reported on
the income statement: buildings, $51,660; machinery and equipment,
$22,680.
Patent amortization reported on the
income statement, $5,040.
A building was constructed for
$579,600.
A mortgage note for $224,000 was
issued for cash.
30,000 shares of common stock were...
The comparative balance sheet of Harris Industries Inc. at December
31, 20Y4 and 20Y3, is as follows:
An examination of the income
statement and the accounting records revealed the following
additional information applicable to 20Y4:
Net income, $524,580.
Depreciation expense reported on
the income statement: buildings, $51,660; machinery and equipment,
$22,680.
Patent amortization reported on the
income statement, $5,040.
A building was constructed for
$579,600.
A mortgage note for $224,000 was
issued for cash.
30,000 shares of common stock were...
 Statement of Cash Flows-Indirect Method The comparative balance sheet of Olson-Jones Industries Inc. for December 31, 2012 and 2041, is as follows: Dec. 31, 2012 Dec. 31, 2011 Assets Cash $183 o Accounts receivable (net) Inventories o Land 250 o on (68) $742 (42) $625 Equipment Accumulated depreciation equipment Total assets Liabilities and Stockholders' Equity Accounts payable (merchandise creditors) Dividends payable Common stock, $1 par Paid-in capital: Excess of issue price over par- common stock Retained earnings u un u...
 Statement of Cash Flows-Indirect Method The comparative balance sheet of Olson-Jones Industries Inc. for December 31, 20Y2 and 2041, is as follows: Dec. 31, Dec. 31, 2012 2011 Assets $155 Cash Accounts receivable (net) Inventories U Land Equipment Accumulated depreciation equipment (19) (10) Total Assets $476 $343 Liabilities and Stockholders' Equity Accounts payable (merchandise creditors) Dividends payable Common stock, $1 par Paid-in capital: Excess of issue price over par- common stock Retained earnings 236 307 $476 Total liabilities and stockholders'...
 Statement of Cash Flows-Indirect Method The comparative balance sheet of Olson-Jones Industries Inc. for December 31, 20Y2 and 2041, is as follows: Dec. 31, 20Y2 Dec. 31, 20Y1 Assets Cash $128 Accounts receivable (net) Inventories Land Equipment Accumulated depreciation-equipment (16) Total Assets $395 $269 Liabilities and Stockholders' Equity Accounts payable (merchandise creditors) Dividends payable Common stock, $1 par Paid-in capital: Excess of issue price over par- common stock Retained earnings 244 Total liabilities and stockholders' equity $395 The following additional...
Most questions answered within 3 hours.
-
Bargaining Models: what is the "Obsolescing Bargain"?
Bargaining Models: what are the factors that would tend...
asked 11 minutes ago -
1. A ball is thrown up into the air.
a) Draw motion diagram and the point-like...
asked 18 minutes ago -
1) Because money eliminates the "double coincidence of wants"
problem, the development of money as a...
asked 49 minutes ago -
Company AAA produces only one product which other manufacturers
purchase as a component for their final...
asked 3 hours ago -
An
item can be appended to an array-based list, provided the lenght is
less than the...
asked 3 hours ago -
Two particles each have a rest mass energy of 30 MeV and are
traveling with a...
asked 5 hours ago -
why
is vectorization a faster alternative to loops?
asked 6 hours ago -
General Matter’s outstanding bond issue has a coupon rate of
11.8%, and it sells at a...
asked 6 hours ago -
Write a one page essay on how important is it to know your basic
accounting knowledge...
asked 6 hours ago -
You are a Senior Civil Engineer posted at the Contracts and
Procurement Division of the Ministry...
asked 6 hours ago -
When using the percentage of completion method, the
company
- recognizes revenues and gross profit each...
asked 6 hours ago -
Is a level production strategy suitable for a pure service
industry, such as professional accounting and...
asked 6 hours ago