![20 pts] In a survey of 400 likely voters, 215 responded that they would vote for the incumbent and 185 responded that they would vote for the challenger. Let p denote the fraction of all likely voters who preferred the incumbent at the time of the survey, and let p be the fraction of survey respondents who preferred the incumbent.](http://img.homeworklib.com/questions/055b48d0-4332-11ea-9777-c356dcb6750b.png?x-oss-process=image/resize,w_560)

Homework Answers
g)
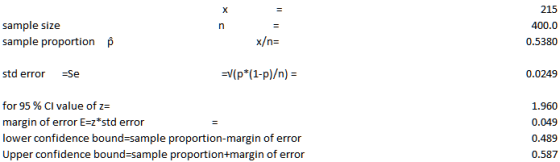
h)
| for 99 % CI value of z= | 2.576 | |||
| margin of error E=z*std error = | 0.064 | |||
| lower confidence bound=sample proportion-margin of error | 0.474 | |||
| Upper confidence bound=sample proportion+margin of error | 0.602 | |||
i)
for part h we require higher confidence and to copensate for higher confidence critical values are higher for distribtuion as more areas in the tail is included ; therefore interval in part h is wider
j)as 95% Confidence interval contains 0.5 as plausible value for population proportion ; therefore we can not reject null hypothesis
Add Answer to:
20 pts] In a survey of 400 likely voters, 215 responded that they would vote for...
(2) 120 pts] In a survey of 400 likely voters, 215 responded that they would vote...
 (2) 120 pts] In a survey of 400 likely voters, 215 responded that they would vote for the incumbent and 185 responded that they would vote for the challenger. Let p denote the fraction of all likely voters who preferred the incumbent at the time of the survey, and let p be the fraction of survey respondents who preferred the incumbent. (a) Use the survey results to estimate p. (b) Use the estimator of the variance of p, p(1 -p)/n,...
show your workings In a survey of 400 likely voters, 213 responded that they would vote...
 show your workings
In a survey of 400 likely voters, 213 responded that they would vote for the incumbent and 187 responded that they would vote for the challenger. Let p denote the fraction of all likely voters who preferred the incumbent at the time of the survey, and lot be the fraction of survey respondents who preferred the incumbent. Using the survey to the estimated value of pis 0.5325. Round your response to four decimal places.) Using Pt-pyn as...
show your workings
In a survey of 400 likely voters, 213 responded that they would vote for the incumbent and 187 responded that they would vote for the challenger. Let p denote the fraction of all likely voters who preferred the incumbent at the time of the survey, and lot be the fraction of survey respondents who preferred the incumbent. Using the survey to the estimated value of pis 0.5325. Round your response to four decimal places.) Using Pt-pyn as...
In a survey of 500 likely voters, 271 responded that they would vote for the incumbent...
In a survey of 500 likely voters, 271 responded that they would vote for the incumbent and 229 responded that they would vote for the challenger. Let pp denote the fraction of all likely voters who preferred the incumbent at the time of the survey, and let p^p^ be the fraction of survey respondents who preferred the incumbent. a. Use the survey results to calculate p^p^. b. Test the hypothesis H0:p=0.5 vs. Ha:p≠0.5H0:p=0.5 vs. Ha:p≠0.5 at the 5% significance level....
In a survey of 500 likely voters, 271 responded that they would vote for the incumbent...
In a survey of 500 likely voters, 271 responded that they would vote for the incumbent and 229 responded that they would vote for the challenger. Let pp denote the fraction of all likely voters who preferred the incumbent at the time of the survey, and let p^p^ be the fraction of survey respondents who preferred the incumbent. a. Construct a 95% confidence interval for pp. Keep in mind that you should calculate the standard error making no assumptions of...
A polling firm called 1,000 likely voters to ask about their political preferences. Of those polled, 520 indicated that they would vote for the incumbent candidate.
A polling firm called 1,000 likely voters to ask about their political preferences. Of those polled, 520 indicated that they would vote for the incumbent candidate. Determine the point estimate for the proportion of voters in the election district who will vote for the incumbent.What is the sampling distribution for p in this example?Approximately how many voters must be polled for a margin of error equal to .01, assuming a confidence level of 95%? Show your work.
We are interested in conducting a study in order to determine what percentage of voters of a state would vote for the in...
We are interested in conducting a study in order to determine what percentage of voters of a state would vote for the incumbent governor. What is the minimum size sample needed to estimate the population proportion with a margin of error of 0.04 at 95% confidence? Use a planning value of p∗= 0.5. a. 601 b. 600 c. 385 d. 307
(20 points) A random sample of n = 1400 registered voters and found that 720 would vote for the Republican candidate in...
 (20 points) A random sample of n = 1400 registered voters and found that 720 would vote for the Republican candidate in a state senate race. Let p represent the proportion of registered voters who would vote for the Republican candidate. Consider testing Ho: p= .50 H,:p> .50 e test statistic is z = (b) Regardless of what you acutally computed, suppose your answer to part (a) was z = 1.28. Using this z, p-value =
A random sample of ?=1400 registered voters and found that 720 would vote for the Republican...
A random sample of ?=1400 registered voters and found that 720 would vote for the Republican candidate in a state senate race. Let ? represent the proportion of registered voters who would vote for the Republican candidate. Consider testing ?0:?=.50 ??:?>.50 a) the test statistic is z = ? b) Regardless of what you actually computed, suppose your answer to part (a) was z = 1.28. Using this z, p-value =?
A random sample of ikely voters showed that 64 % planned to vote for Candidate X,...
 A random sample of ikely voters showed that 64 % planned to vote for Candidate X, with a margin of eror of 1 percentage points and with 95 % confidence, a. Use a carefully worded sentence to report the 95 % confidence interval for the percentage of voters who plan to vote for Candidate X b. Is there evidence that Candidate X could lose? c. Suppose the survey was taken on the streets of a particular city and the candidate...
1.) Voting records show that 61% of eligible voters actually did vote in a recent presidential...
1.) Voting records show that 61% of eligible voters actually did vote in a recent presidential election. In a survey of 1002 people, 70% said that they voted in that election. Use the survey results to test the claim that the percentage of all voters who say that they voted is equal to 61%. Test the claim by constructing an appropriate confidence interval. What are the null and alternative hypotheses? What is the value of = significance level? Is the...
 (2) 120 pts] In a survey of 400 likely voters, 215 responded that they would vote for the incumbent and 185 responded that they would vote for the challenger. Let p denote the fraction of all likely voters who preferred the incumbent at the time of the survey, and let p be the fraction of survey respondents who preferred the incumbent. (a) Use the survey results to estimate p. (b) Use the estimator of the variance of p, p(1 -p)/n,...
 show your workings
In a survey of 400 likely voters, 213 responded that they would vote for the incumbent and 187 responded that they would vote for the challenger. Let p denote the fraction of all likely voters who preferred the incumbent at the time of the survey, and lot be the fraction of survey respondents who preferred the incumbent. Using the survey to the estimated value of pis 0.5325. Round your response to four decimal places.) Using Pt-pyn as...
show your workings
In a survey of 400 likely voters, 213 responded that they would vote for the incumbent and 187 responded that they would vote for the challenger. Let p denote the fraction of all likely voters who preferred the incumbent at the time of the survey, and lot be the fraction of survey respondents who preferred the incumbent. Using the survey to the estimated value of pis 0.5325. Round your response to four decimal places.) Using Pt-pyn as...
 (20 points) A random sample of n = 1400 registered voters and found that 720 would vote for the Republican candidate in a state senate race. Let p represent the proportion of registered voters who would vote for the Republican candidate. Consider testing Ho: p= .50 H,:p> .50 e test statistic is z = (b) Regardless of what you acutally computed, suppose your answer to part (a) was z = 1.28. Using this z, p-value =
 A random sample of ikely voters showed that 64 % planned to vote for Candidate X, with a margin of eror of 1 percentage points and with 95 % confidence, a. Use a carefully worded sentence to report the 95 % confidence interval for the percentage of voters who plan to vote for Candidate X b. Is there evidence that Candidate X could lose? c. Suppose the survey was taken on the streets of a particular city and the candidate...
Most questions answered within 3 hours.
-
The average length of time between arrivals at a turnpike
toll-booth is 26 seconds. What is...
asked 1 hour ago -
(a) A piston at 6.1 atm contains a gas that occupies a volume of
3.5 L....
asked 2 hours ago -
Please answer true or false. Words
cannot be changed or added in to make it true...
asked 2 hours ago -
An empty test tube weighs 15.923 grams. Then,
MgCl2•6H2O is added into the test tube. After...
asked 2 hours ago -
Assume memory access is 10 units of time and disk access is
10000 units of time....
asked 2 hours ago -
1. Are all good samples random?
2. Magazines often report surveys giving statistics such as “63%...
asked 2 hours ago -
Under all the various types of market structures, firms
must eventually earn some economic profits for...
asked 2 hours ago -
Consider the following fitness regime for a single locus trait
with two co-dominant alleles: w11 =...
asked 2 hours ago -
A large cable company reports the following.
80% of its customers subscribe to its cable TV...
asked 3 hours ago -
Please answer the question in brief.
Discuss the role of ERP in organizations. Are ERP tools...
asked 2 hours ago -
Discuss the pros and cons of collaborative software such
as SameTime. Does it increase productivity? What...
asked 3 hours ago -
Buying your in-laws a gift because it’s expected is
due to the ____________ motive of gift-giving....
asked 3 hours ago