
Homework Answers

Add Answer to:
1. (40 points) Refer to the graph below to answer the following questions Home's Import-Competing Industry...
1) The United States sugar industry has enjoyed trade protection for several years. As a result,...
 1) The United States sugar industry has enjoyed trade protection for several years. As a result, sugar prices in the U.S. are higher than the average world price. Suppose that the domestic demand and domestic supply for sugar are as provided in the table below (assume continuous, linear domestic demand and supply curves which include the following data points for sugar): | Price ($ per Quantity Demanded Domestically Quantity Supplied Domestically pound) (Millions of Pounds per Year) (Millions of Pounds...
please only do problem d e and f thanks! 1) The United States sugar industry has enjoyed trade protection for several y...
 please only do problem d e and f
thanks!
1) The United States sugar industry has enjoyed trade protection for several years. As a result, sugar prices in the U.S. are higher than the average world price. Suppose that the domestic demand and domestic supply for sugar are as provided in the table below (assume continuous, linear domestic demand and supply curves which include the following data points for sugar): | Price ($ per Quantity Demanded Domestically Quantity Supplied Domestically...
please only do problem d e and f
thanks!
1) The United States sugar industry has enjoyed trade protection for several years. As a result, sugar prices in the U.S. are higher than the average world price. Suppose that the domestic demand and domestic supply for sugar are as provided in the table below (assume continuous, linear domestic demand and supply curves which include the following data points for sugar): | Price ($ per Quantity Demanded Domestically Quantity Supplied Domestically...
7. Suppose the following diagram illustrates an import model. Using this diagram, what is the area...
 7. Suppose the following diagram illustrates an import model. Using this diagram, what is the area of consumer and producer surplus: a. in autarky? b. with imports? C with a trade tariff? Domestic CA BIC ID PA E FI HII Nis Pw P Q R S Pr LithT - Pwl tariff -- WORLD price Situ! D Domestic QA Х Notation: A: Antarky T: tariff W: WORLD Quantity Y Price
1) The United States sugar industry has enjoyed trade protection for several years. As a result,...
 1) The United States sugar industry has enjoyed trade protection for several years. As a result, sugar prices in the U.S. are higher than the average world price. Suppose that the domestic demand and domestic supply for sugar are as provided in the table below (assume continuous, linear domestic demand and supply curves which include the following data points for sugar): | Price ($ per Quantity Demanded Domestically Quantity Supplied Domestically pound) (Millions of Pounds per Year) (Millions of Pounds...
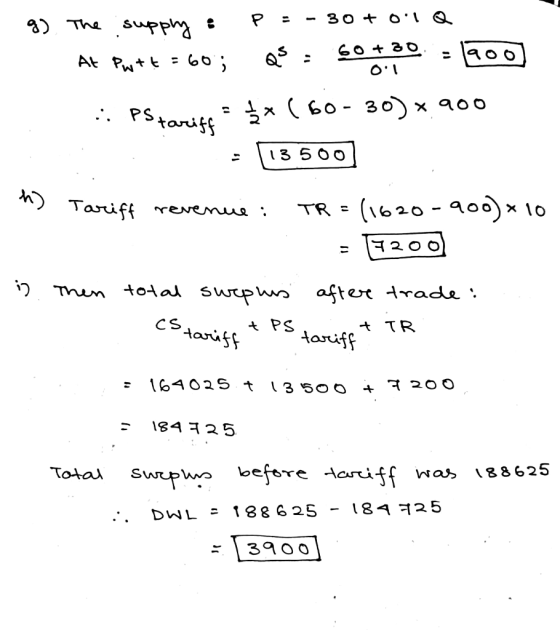
Price So 1 Po PwT Pw 4 5 9 10 6 7 11 12 13 14 Do Qi 2 0 04 Qs Qantity The graph above depicts the domestic market for good X. Domestic demand and supply are represented by DD and So respectively....
 Price So 1 Po PwT Pw 4 5 9 10 6 7 11 12 13 14 Do Qi 2 0 04 Qs Qantity The graph above depicts the domestic market for good X. Domestic demand and supply are represented by DD and So respectively. The domestic price is Po and the world price is Pw. The price Pw-T, represents the world price plus a tariff. If the domestic country's government wanted to maximize total surplus then O the government should...
Need help on Questions 9 and 10. Is the tariff imposed on the equilibrium price at...
 Need help on Questions 9 and 10. Is the tariff imposed on the
equilibrium price at $6 or is it imposed on the World Trade price
at $2?
Consumer Surplus, Producer Surplus and Net Benefits (Show all your work). Name (Print): Course: Use the following graph for questions 1-15. P $12- Supply SIO $8 S6 54 SZVU Demand $0 10 211 30 40 50 P.S Quantity 1. Estimate an equation for the demand and supply curves shown in the diagram...
Need help on Questions 9 and 10. Is the tariff imposed on the
equilibrium price at $6 or is it imposed on the World Trade price
at $2?
Consumer Surplus, Producer Surplus and Net Benefits (Show all your work). Name (Print): Course: Use the following graph for questions 1-15. P $12- Supply SIO $8 S6 54 SZVU Demand $0 10 211 30 40 50 P.S Quantity 1. Estimate an equation for the demand and supply curves shown in the diagram...
3. By looking to the following Figure indicate whether import Tariff Imposed by a Small Country...
 3. By looking to the following Figure indicate whether import Tariff Imposed by a Small Country will increase or decrease the following indicators by giving the reasons • Price effect • Consumption effect • Production (or protective) effect • Imports effect • Government revenue effect • Consumer surplus effect • Producer surplus effect : Р. 2 b c Pw Tariff 0 8 0, 1. By looking to the following Figure indicate whether Free Trade will increase or decrease the following...
CI OD Use the graph below to answer this question: In autarky (before trade) consumer surplus...
 CI OD Use the graph below to answer this question: In autarky (before trade) consumer surplus is the area represented by the letter(s) (For this question and the following ones that use the same graph, Sis domestic supply, D is domestic demand. Pw is the world price. t is the tariff.) B to A : Question 7
can you answer question 3 only plz thank you i need it as soon as possible Home demand: D 100-20P Home supply: S 30+20P What is the import demand schedule in home country, what is the equilibrium...
 can you answer question 3 only plz thank you i need it as soon
as possible
Home demand: D 100-20P Home supply: S 30+20P What is the import demand schedule in home country, what is the equilibrium price without trade? b Please draw the demand and supply curves at home, calculate and mark domestic consumer surplus and producer surplus without trade on the graph. 2 Foreign demand D 80-20P* Foreign supply: S 50 20P* What is the export supply schedule...
can you answer question 3 only plz thank you i need it as soon
as possible
Home demand: D 100-20P Home supply: S 30+20P What is the import demand schedule in home country, what is the equilibrium price without trade? b Please draw the demand and supply curves at home, calculate and mark domestic consumer surplus and producer surplus without trade on the graph. 2 Foreign demand D 80-20P* Foreign supply: S 50 20P* What is the export supply schedule...
Tariff Analytical Question: Figure: A Tariff on Oranges in South Africa Price of oranges Domestic supply Pt 5.00 G Pw3....
 Tariff Analytical Question: Figure: A Tariff on Oranges in South Africa Price of oranges Domestic supply Pt 5.00 G Pw3.00 Domestic demand P-1.00 100 150 250 290 Quantity of oranges Use the following graph and information to answer the following questions: 1) Assume that the world price of Oranges (Pw) is $3.00 per pound. Domestic Quantity Supply is 100, and the Domestic Quantity Demanded is 290 at the current world price of $3.00 What is the level of imports in...
 1) The United States sugar industry has enjoyed trade protection for several years. As a result, sugar prices in the U.S. are higher than the average world price. Suppose that the domestic demand and domestic supply for sugar are as provided in the table below (assume continuous, linear domestic demand and supply curves which include the following data points for sugar): | Price ($ per Quantity Demanded Domestically Quantity Supplied Domestically pound) (Millions of Pounds per Year) (Millions of Pounds...
 please only do problem d e and f
thanks!
1) The United States sugar industry has enjoyed trade protection for several years. As a result, sugar prices in the U.S. are higher than the average world price. Suppose that the domestic demand and domestic supply for sugar are as provided in the table below (assume continuous, linear domestic demand and supply curves which include the following data points for sugar): | Price ($ per Quantity Demanded Domestically Quantity Supplied Domestically...
please only do problem d e and f
thanks!
1) The United States sugar industry has enjoyed trade protection for several years. As a result, sugar prices in the U.S. are higher than the average world price. Suppose that the domestic demand and domestic supply for sugar are as provided in the table below (assume continuous, linear domestic demand and supply curves which include the following data points for sugar): | Price ($ per Quantity Demanded Domestically Quantity Supplied Domestically...
 7. Suppose the following diagram illustrates an import model. Using this diagram, what is the area of consumer and producer surplus: a. in autarky? b. with imports? C with a trade tariff? Domestic CA BIC ID PA E FI HII Nis Pw P Q R S Pr LithT - Pwl tariff -- WORLD price Situ! D Domestic QA Х Notation: A: Antarky T: tariff W: WORLD Quantity Y Price
 1) The United States sugar industry has enjoyed trade protection for several years. As a result, sugar prices in the U.S. are higher than the average world price. Suppose that the domestic demand and domestic supply for sugar are as provided in the table below (assume continuous, linear domestic demand and supply curves which include the following data points for sugar): | Price ($ per Quantity Demanded Domestically Quantity Supplied Domestically pound) (Millions of Pounds per Year) (Millions of Pounds...
 Price So 1 Po PwT Pw 4 5 9 10 6 7 11 12 13 14 Do Qi 2 0 04 Qs Qantity The graph above depicts the domestic market for good X. Domestic demand and supply are represented by DD and So respectively. The domestic price is Po and the world price is Pw. The price Pw-T, represents the world price plus a tariff. If the domestic country's government wanted to maximize total surplus then O the government should...
 Need help on Questions 9 and 10. Is the tariff imposed on the
equilibrium price at $6 or is it imposed on the World Trade price
at $2?
Consumer Surplus, Producer Surplus and Net Benefits (Show all your work). Name (Print): Course: Use the following graph for questions 1-15. P $12- Supply SIO $8 S6 54 SZVU Demand $0 10 211 30 40 50 P.S Quantity 1. Estimate an equation for the demand and supply curves shown in the diagram...
Need help on Questions 9 and 10. Is the tariff imposed on the
equilibrium price at $6 or is it imposed on the World Trade price
at $2?
Consumer Surplus, Producer Surplus and Net Benefits (Show all your work). Name (Print): Course: Use the following graph for questions 1-15. P $12- Supply SIO $8 S6 54 SZVU Demand $0 10 211 30 40 50 P.S Quantity 1. Estimate an equation for the demand and supply curves shown in the diagram...
 3. By looking to the following Figure indicate whether import Tariff Imposed by a Small Country will increase or decrease the following indicators by giving the reasons • Price effect • Consumption effect • Production (or protective) effect • Imports effect • Government revenue effect • Consumer surplus effect • Producer surplus effect : Р. 2 b c Pw Tariff 0 8 0, 1. By looking to the following Figure indicate whether Free Trade will increase or decrease the following...
 CI OD Use the graph below to answer this question: In autarky (before trade) consumer surplus is the area represented by the letter(s) (For this question and the following ones that use the same graph, Sis domestic supply, D is domestic demand. Pw is the world price. t is the tariff.) B to A : Question 7
 can you answer question 3 only plz thank you i need it as soon
as possible
Home demand: D 100-20P Home supply: S 30+20P What is the import demand schedule in home country, what is the equilibrium price without trade? b Please draw the demand and supply curves at home, calculate and mark domestic consumer surplus and producer surplus without trade on the graph. 2 Foreign demand D 80-20P* Foreign supply: S 50 20P* What is the export supply schedule...
can you answer question 3 only plz thank you i need it as soon
as possible
Home demand: D 100-20P Home supply: S 30+20P What is the import demand schedule in home country, what is the equilibrium price without trade? b Please draw the demand and supply curves at home, calculate and mark domestic consumer surplus and producer surplus without trade on the graph. 2 Foreign demand D 80-20P* Foreign supply: S 50 20P* What is the export supply schedule...
 Tariff Analytical Question: Figure: A Tariff on Oranges in South Africa Price of oranges Domestic supply Pt 5.00 G Pw3.00 Domestic demand P-1.00 100 150 250 290 Quantity of oranges Use the following graph and information to answer the following questions: 1) Assume that the world price of Oranges (Pw) is $3.00 per pound. Domestic Quantity Supply is 100, and the Domestic Quantity Demanded is 290 at the current world price of $3.00 What is the level of imports in...
Most questions answered within 3 hours.
-
The manager at a car assembly plant believes that the mean
assembly time for a car...
asked 11 minutes ago -
Which of the following is true of electron capture?
A) It decreases the nuclide's mass number...
asked 1 hour ago -
Assuming an efficiency of 43.10%, calculate the actual yield of
magnesium nitrate formed from 114.9 g...
asked 2 hours ago -
The highly pathogenic bacterium Clostridium
perfringens causes gangrene, a disease that results in the
destruction of...
asked 4 hours ago -
In the context of situation analysis, which of the following is
a category for analysis in...
asked 4 hours ago -
In a study of the gas phase decomposition of sulfuryl chloride
at 600 K SO2Cl2(g)SO2(g) +...
asked 4 hours ago -
75 g of 2-propanol (C3H8O) and 25 g of pentane are mixed in a
200 mL...
asked 4 hours ago -
The 2800-turn coil in a dc motor has an area per turn of 1.1 ×
10-2...
asked 4 hours ago -
Draw a combinational logic circuit diagram with a symbol inside
the box for two I/P of...
asked 4 hours ago -
The cliché we use quite a lot in finance is: there is a need to
maximize...
asked 4 hours ago -
In class we discussed the addition of HCl to alpha pinene. Would
you expect one or...
asked 4 hours ago -
I'm trying to explain to my daughter to help her please help
me
I tagged the...
asked 4 hours ago