Need help printing out this specific table in rstudio that contains the results: mean, sample size,...
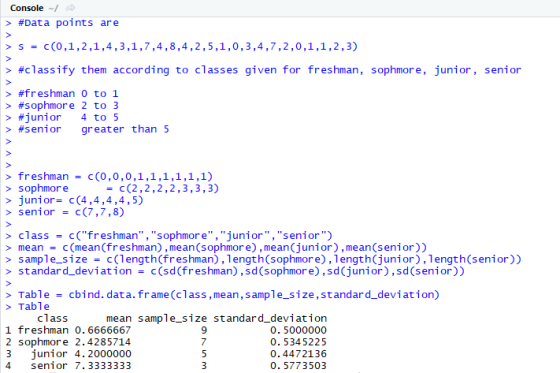
Need help printing out this specific table in rstudio that contains the results: mean, sample size, and standard deviation:
| class | mean | sample size | standard deviation |
| freshman | |||
| sophmore | |||
| junior | |||
| senior |
prompt: Let's say that the classes are set the following:freshman(0-1 semester), sophomore (2-3 semester), junior (4-5 semester) and senior (more than 5).
Here is the data given, called surveydata:
| Semester |
| 0 |
| 1 |
|
2 |
| 1 |
| 4 |
| 3 |
| 1 |
| 7 |
| 4 |
| 8 |
| 4 |
| 2 |
| 5 |
| 1 |
| 0 |
| 3 |
| 4 |
| 7 |
| 2 |
| 0 |
| 1 |
| 1 |
| 2 |
| 3 |
Homework Answers
R studio codes
for calculating mean use mean function
for calculating sample size use length function
for calculating standard deviation use sd function
Add Answer to:
Need help printing out this specific table in rstudio that contains the results: mean, sample size,...
Here is a chart depicting some of the data I collected at the beginning of the...
Here is a chart depicting some of the data I collected at the beginning of the semester. ID# What is your GPA? What grade are you in? How many books have you read this year? 1 3.74 Sophomore 8 2 3.07 Junior 2 3 3.2 Junior 5 4 3.5 Freshman 10 5 2.75 Freshman 1 6 2.6 Senior 2 7 2.72 Junior 8 8 3.4 Junior 3 9 4 Freshman 3 10 3 Junior 3 11 3.2 Senior 2 12...
To test whether students in a higher grade level will be less disruptive in class, a...
To test whether students in a higher grade level will be less disruptive in class, a school psychologist records the number of documented interruptions during one day of classes from nine local high schools. The sample consisted of nine (n = 9) freshman, sophomore, junior, and senior high school classes. The data for each high school class are given in the table. High School Class Freshman Sophomore Junior Senior 0 2 5 3 4 0 3 2 1 4 5...
High School Class Sophomore Junior Senior Freshman 1 2 4 0 3 2 5 3 4...
 High School Class Sophomore Junior Senior Freshman 1 2 4 0 3 2 5 3 4 60 5 0 3 4 0 0 2 4 4 5 1. List the mean and standard deviation for each of the 4 Class groups. 2. Describe the ANOVA results: What did For equal? Was it significant? 3. What was the eta-squared effect size? Would this be considered a small, moderate, or large effect according to Cohen's conventions? (You will need to calculate this...
To test whether students in a higher grade level will be less disruptive in class, a...
To test whether students in a higher grade level will be less disruptive in class, a school psychologist records the number of documented interruptions during one day of classes from nine local high schools. The sample consisted of nine (n = 9) freshman, sophomore, junior, and senior high school classes. The data for each high school class are given in the table. High School Class Freshman Sophomore Junior Senior 2 3 1 5 4 2 3 2 1 2 ...
A data analyst is conducting a study to determine if the mean number of courses taken...
A data analyst is conducting a study to determine if the mean number of courses taken in a college semester is statistically the same between freshmen, sophomores, juniors, and seniors. To collect data for this ANOVA test, the statistician randomly selects students attending college and records their year and the number of courses each is taking in the current semester, as shown in the table below. Assume the conditions necessary for a one-way ANOVA are met. Complete the ANOVA table...
Computer Science Problem C++ cla5a.cpp 1 // cla10a BY student name, CSCI 2170-section 2 //File: cla10a.cpp...
 Computer Science Problem C++
cla5a.cpp
1 // cla10a BY student name, CSCI 2170-section
2 //File: cla10a.cpp
3 //Author: Dr. Roland H. Untch
4 //Purpose: This program displays a student's classification
5 // (e.g., "freshman", "sophmore", etc.) based on an
6 // integer classification code that is read in. In
7 // it's current form, this program uses nested IF
8 // statements to encode a "multiway branch" or "case
9 // construct" to determine the student's classification.
10 // As...
Computer Science Problem C++
cla5a.cpp
1 // cla10a BY student name, CSCI 2170-section
2 //File: cla10a.cpp
3 //Author: Dr. Roland H. Untch
4 //Purpose: This program displays a student's classification
5 // (e.g., "freshman", "sophmore", etc.) based on an
6 // integer classification code that is read in. In
7 // it's current form, this program uses nested IF
8 // statements to encode a "multiway branch" or "case
9 // construct" to determine the student's classification.
10 // As...
can someone help with this? need to use c++. The aim of this homework assignment is...
 can someone help with this? need to use c++.
The aim of this homework assignment is to practice writing classes. This homework assignment will help build towards project I, which will be to write a program implementing Management of Rosters System. For this assignment, write a class called Student. This class should contain information of a single student. This information includes: last name, first name, standing, credits gpa, date of birth, matriculation date. For now you can store date of...
can someone help with this? need to use c++.
The aim of this homework assignment is to practice writing classes. This homework assignment will help build towards project I, which will be to write a program implementing Management of Rosters System. For this assignment, write a class called Student. This class should contain information of a single student. This information includes: last name, first name, standing, credits gpa, date of birth, matriculation date. For now you can store date of...
Download the attached data file. Use the data file to answer the questions 1 to 5...
 Download the attached data file. Use the data file to answer the questions 1 to 5 1. Select a proper variable and use a bar graph to describe the distributions of this variable (show percentage, increasingly) a. Use a paragraph to describe the frequency distribution and relative frequency of this variable. Indicate the mode 2. Construct two pie charts by using another proper variable by further dividing this variable into two categories with another two-leveled variable a. Also, use a...
please show work 1) The distribution of sample means (for a specific sample size) consists of...
 please show work
1) The distribution of sample means (for a specific sample size) consists of a. All the scores contained in the sample x b. All the scores contained in the population x C. All the samples means that could be obtained (for the specific sample size) d. The specific sample mean computed for the sample of scores 2) A sample of n=25 scores is determined to have a standard error of 2 points. What is the standard deviation...
please show work
1) The distribution of sample means (for a specific sample size) consists of a. All the scores contained in the sample x b. All the scores contained in the population x C. All the samples means that could be obtained (for the specific sample size) d. The specific sample mean computed for the sample of scores 2) A sample of n=25 scores is determined to have a standard error of 2 points. What is the standard deviation...
 High School Class Sophomore Junior Senior Freshman 1 2 4 0 3 2 5 3 4 60 5 0 3 4 0 0 2 4 4 5 1. List the mean and standard deviation for each of the 4 Class groups. 2. Describe the ANOVA results: What did For equal? Was it significant? 3. What was the eta-squared effect size? Would this be considered a small, moderate, or large effect according to Cohen's conventions? (You will need to calculate this...
 Computer Science Problem C++
cla5a.cpp
1 // cla10a BY student name, CSCI 2170-section
2 //File: cla10a.cpp
3 //Author: Dr. Roland H. Untch
4 //Purpose: This program displays a student's classification
5 // (e.g., "freshman", "sophmore", etc.) based on an
6 // integer classification code that is read in. In
7 // it's current form, this program uses nested IF
8 // statements to encode a "multiway branch" or "case
9 // construct" to determine the student's classification.
10 // As...
Computer Science Problem C++
cla5a.cpp
1 // cla10a BY student name, CSCI 2170-section
2 //File: cla10a.cpp
3 //Author: Dr. Roland H. Untch
4 //Purpose: This program displays a student's classification
5 // (e.g., "freshman", "sophmore", etc.) based on an
6 // integer classification code that is read in. In
7 // it's current form, this program uses nested IF
8 // statements to encode a "multiway branch" or "case
9 // construct" to determine the student's classification.
10 // As...
 can someone help with this? need to use c++.
The aim of this homework assignment is to practice writing classes. This homework assignment will help build towards project I, which will be to write a program implementing Management of Rosters System. For this assignment, write a class called Student. This class should contain information of a single student. This information includes: last name, first name, standing, credits gpa, date of birth, matriculation date. For now you can store date of...
can someone help with this? need to use c++.
The aim of this homework assignment is to practice writing classes. This homework assignment will help build towards project I, which will be to write a program implementing Management of Rosters System. For this assignment, write a class called Student. This class should contain information of a single student. This information includes: last name, first name, standing, credits gpa, date of birth, matriculation date. For now you can store date of...
 Download the attached data file. Use the data file to answer the questions 1 to 5 1. Select a proper variable and use a bar graph to describe the distributions of this variable (show percentage, increasingly) a. Use a paragraph to describe the frequency distribution and relative frequency of this variable. Indicate the mode 2. Construct two pie charts by using another proper variable by further dividing this variable into two categories with another two-leveled variable a. Also, use a...
 Download the attached data file. Use the data file to answer the questions 1 to 5 1. Select a proper variable and use a bar graph to describe the distributions of this variable (show percentage, increasingly) a. Use a paragraph to describe the frequency distribution and relative frequency of this variable. Indicate the mode 2. Construct two pie charts by using another proper variable by further dividing this variable into two categories with another two-leveled variable a. Also, use a...
 please show work
1) The distribution of sample means (for a specific sample size) consists of a. All the scores contained in the sample x b. All the scores contained in the population x C. All the samples means that could be obtained (for the specific sample size) d. The specific sample mean computed for the sample of scores 2) A sample of n=25 scores is determined to have a standard error of 2 points. What is the standard deviation...
please show work
1) The distribution of sample means (for a specific sample size) consists of a. All the scores contained in the sample x b. All the scores contained in the population x C. All the samples means that could be obtained (for the specific sample size) d. The specific sample mean computed for the sample of scores 2) A sample of n=25 scores is determined to have a standard error of 2 points. What is the standard deviation...
Most questions answered within 3 hours.
-
Other decisions about scientific claims can have a much broader
impact.ENERGYarrow-10x10.png, environment, health, security - all...
asked 13 minutes ago -
I need to write a research paper and work cited about this
topic: The United States...
asked 36 minutes ago -
Hello! I was wondering if I could have some help?
If the vapor pressure of carvone...
asked 58 minutes ago -
An economist wants to estimate the mean per capita income (in
thousands of dollars) for a...
asked 1 hour ago -
What would be the input/output characteristic of a circuit
obtained by putting two of your 2's-complementers...
asked 1 hour ago -
In Drosophila, the transition from the syncytial blastoderm
stage to the cellular blastoderm stage is a...
asked 1 hour ago -
Project management question:
Name 3 different types of resources (hint: humans are one
type)
asked 1 hour ago -
Consider the following reaction: C 2H 2( g) + 2H 2( g) C 2H 6(
g)...
asked 2 hours ago -
Consider a 1.0 L buffer containing 0.092 mol L-1 HCOOH and 0.100
mol L-1 HCOO-. What...
asked 2 hours ago -
Koch Realty has owned a vacant land with a FMV of
$775,000 and an adjusted basis...
asked 2 hours ago -
It is estimated 29% of all adults in United States invest in
stocks and that 85%...
asked 2 hours ago -
What does a 2-sided p value of 0.04 mean? (I am not asking if it
is...
asked 2 hours ago