


Homework Answers
1.
C. There is not enough information
2.
D. It is impossible to tell from the boxes
3.
A. Statstown
4.
A. Both cities have the same percentage
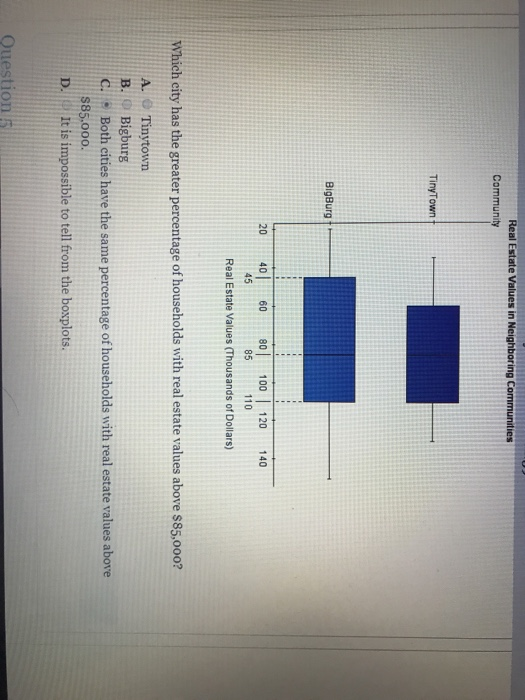
5.
A. Tinytown
Add Answer to:
Answer in order please thank you. Question1 A survey was conducted from a random sample of...
The next 4 questions relate to the same boxplot graph, shown below. Question 4 of 7...
 The next 4 questions relate to the same boxplot graph, shown
below.
Question 4 of 7
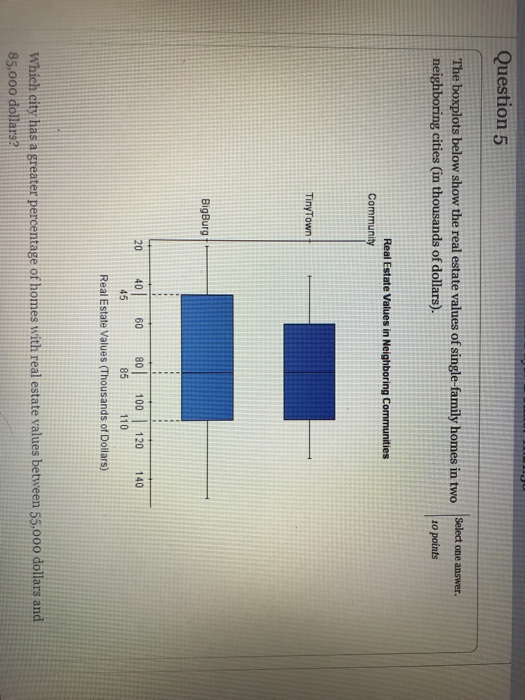
The boxplots below show the real estate values of single family
homes in 2 neighboring cities (in thousands of dollars).
Which city has more homes?
A. Tinytown
B. Bigburg
C. Both cities have the same number of households.
D. It is impossible to tell from the boxplots.
Question 5 of 7
Here again are the boxplots showing the real estate values of
single family...
The next 4 questions relate to the same boxplot graph, shown
below.
Question 4 of 7
The boxplots below show the real estate values of single family
homes in 2 neighboring cities (in thousands of dollars).
Which city has more homes?
A. Tinytown
B. Bigburg
C. Both cities have the same number of households.
D. It is impossible to tell from the boxplots.
Question 5 of 7
Here again are the boxplots showing the real estate values of
single family...
Please help with the following, I have already done most of them. Please verify Question1 Select...
 Please help with the following, I have already done most of
them. Please verify
Question1 Select one answer The histogram below displays the distribution of so ages at death due to trauma (unnatural accidents and homicides) that were observed in a certain hospital during a week. opoints 18 16 14 12 10 а» 10 20 30 40 50 60 70 80 90 Age Which of the following are the appropriate numerical measures to describe the center and spread of the...
Please help with the following, I have already done most of
them. Please verify
Question1 Select one answer The histogram below displays the distribution of so ages at death due to trauma (unnatural accidents and homicides) that were observed in a certain hospital during a week. opoints 18 16 14 12 10 а» 10 20 30 40 50 60 70 80 90 Age Which of the following are the appropriate numerical measures to describe the center and spread of the...
Answer 10-13 first please Countdown: Days-2 1ime:-10:17:03 Question 11 The distribution of IQ (Intelligence Quotient) is...
 Answer 10-13 first please
Countdown: Days-2 1ime:-10:17:03 Question 11 The distribution of IQ (Intelligence Quotient) is approximately normal inType numbers in the boxes. shape with a mean of 100 and a standard deviation of 12. o points According to the standard deviation rule, % of people have an IQ between 76 and 124. Do not round. Question 12 Type numbers in the boxes. The distribution of IQ (Intelligence Quotient) is approximately normal in shape with a mean of 100 and...
Answer 10-13 first please
Countdown: Days-2 1ime:-10:17:03 Question 11 The distribution of IQ (Intelligence Quotient) is approximately normal inType numbers in the boxes. shape with a mean of 100 and a standard deviation of 12. o points According to the standard deviation rule, % of people have an IQ between 76 and 124. Do not round. Question 12 Type numbers in the boxes. The distribution of IQ (Intelligence Quotient) is approximately normal in shape with a mean of 100 and...
Please answer all of the following. The boxplot below shows the number of contacts in their...
 Please answer all of the following.
The boxplot below shows the number of contacts in their cell by gender for my Spring 2018 statistics classes. Using the boxplot, answer the 4 questions below. Boxplot of CellNumbers 900 800 700 600 500 400 300 200 100 0 Male Female Gender CellNumbers Which distribution has 3 outliers? Which distribution appears skewed right, excluding 1. Male 1 outliers? 2. Female Which distribution is 1 3. Both less variable (has the smaller IQR)? 4....
Please answer all of the following.
The boxplot below shows the number of contacts in their cell by gender for my Spring 2018 statistics classes. Using the boxplot, answer the 4 questions below. Boxplot of CellNumbers 900 800 700 600 500 400 300 200 100 0 Male Female Gender CellNumbers Which distribution has 3 outliers? Which distribution appears skewed right, excluding 1. Male 1 outliers? 2. Female Which distribution is 1 3. Both less variable (has the smaller IQR)? 4....
Page 1 Question 1 Suppose we take repeated random samples of size 20 from a population...
 Page 1 Question 1 Suppose we take repeated random samples of size 20 from a population with a Select all that apply. mean of 60 and a standard deviation of 8. Which of the following statements is 10 points true about the sampling distribution of the sample mean (x)? Check all that apply. A. The distribution is normal regardless of the shape of the population distribution, because the sample size is large enough. B. The distribution will be normal as...
I want answer those question, please help me.
1. Short answer only.a. Suppose that we tell you that we flipped a coin multiple times and it landed heads 75% of the time. Would you be reasonably convinced that this was not a fair coin (where “fair” means that the coin has a .5 probability of landing “heads”)? If so, explain why. If not, describe what additional information you would ask for and explain why it is necessary.b. A college professor asked students in his class to report how...
Please answer all parts of question. Thank you! Discrete Probability Distributions: part 1 1. Consider the...
 Please answer all parts of question. Thank you!
Discrete Probability Distributions: part 1 1. Consider the experiment of rolling two dice. a.) Define a random variable that takes on all possible values for the minimum value of the two dice face showing when the dice come to rest after the roll. b.) Before doing anything at all (do not write out the distribution yet), think about this experiment and the random variable. Tell me what you think the shape of...
Please answer all parts of question. Thank you!
Discrete Probability Distributions: part 1 1. Consider the experiment of rolling two dice. a.) Define a random variable that takes on all possible values for the minimum value of the two dice face showing when the dice come to rest after the roll. b.) Before doing anything at all (do not write out the distribution yet), think about this experiment and the random variable. Tell me what you think the shape of...
please show the steps and formulas needed in order to correctly answer each question. thank you...
 please show the steps and formulas needed in order to
correctly answer each question. thank you in advance.
6) In a survey of 327 registered voters, 167 of them wished to see Mayor Waffleskate lose her next election. Find a point estimate for the proportion of registered voters who wish to see Mayor Waffleskate defeated 7) A survey of 800 women shoppers found that 17 % of them shop confidence interval for the true proportion of women shoppers who shop...
please show the steps and formulas needed in order to
correctly answer each question. thank you in advance.
6) In a survey of 327 registered voters, 167 of them wished to see Mayor Waffleskate lose her next election. Find a point estimate for the proportion of registered voters who wish to see Mayor Waffleskate defeated 7) A survey of 800 women shoppers found that 17 % of them shop confidence interval for the true proportion of women shoppers who shop...
objective question What is the mode and the mean for the following set of numbers? {4,9,8,2,16,4,4,8,9,6}...
 objective question
What is the mode and the mean for the following set of numbers? {4,9,8,2,16,4,4,8,9,6} O A. Mean = 7, mode =8 O B. Mean = 7, mode =4 O C. Mean = 6, mode =8 O D. Mean = 8, mode =9 You are conducting a survey of the people of the United Kingdom to find out how popular the racket sports are. You randomly choose people to call, and make 1,000 phone calls to people scattered across...
objective question
What is the mode and the mean for the following set of numbers? {4,9,8,2,16,4,4,8,9,6} O A. Mean = 7, mode =8 O B. Mean = 7, mode =4 O C. Mean = 6, mode =8 O D. Mean = 8, mode =9 You are conducting a survey of the people of the United Kingdom to find out how popular the racket sports are. You randomly choose people to call, and make 1,000 phone calls to people scattered across...
 The next 4 questions relate to the same boxplot graph, shown
below.
Question 4 of 7
The boxplots below show the real estate values of single family
homes in 2 neighboring cities (in thousands of dollars).
Which city has more homes?
A. Tinytown
B. Bigburg
C. Both cities have the same number of households.
D. It is impossible to tell from the boxplots.
Question 5 of 7
Here again are the boxplots showing the real estate values of
single family...
The next 4 questions relate to the same boxplot graph, shown
below.
Question 4 of 7
The boxplots below show the real estate values of single family
homes in 2 neighboring cities (in thousands of dollars).
Which city has more homes?
A. Tinytown
B. Bigburg
C. Both cities have the same number of households.
D. It is impossible to tell from the boxplots.
Question 5 of 7
Here again are the boxplots showing the real estate values of
single family...
 Please help with the following, I have already done most of
them. Please verify
Question1 Select one answer The histogram below displays the distribution of so ages at death due to trauma (unnatural accidents and homicides) that were observed in a certain hospital during a week. opoints 18 16 14 12 10 а» 10 20 30 40 50 60 70 80 90 Age Which of the following are the appropriate numerical measures to describe the center and spread of the...
Please help with the following, I have already done most of
them. Please verify
Question1 Select one answer The histogram below displays the distribution of so ages at death due to trauma (unnatural accidents and homicides) that were observed in a certain hospital during a week. opoints 18 16 14 12 10 а» 10 20 30 40 50 60 70 80 90 Age Which of the following are the appropriate numerical measures to describe the center and spread of the...
 Answer 10-13 first please
Countdown: Days-2 1ime:-10:17:03 Question 11 The distribution of IQ (Intelligence Quotient) is approximately normal inType numbers in the boxes. shape with a mean of 100 and a standard deviation of 12. o points According to the standard deviation rule, % of people have an IQ between 76 and 124. Do not round. Question 12 Type numbers in the boxes. The distribution of IQ (Intelligence Quotient) is approximately normal in shape with a mean of 100 and...
Answer 10-13 first please
Countdown: Days-2 1ime:-10:17:03 Question 11 The distribution of IQ (Intelligence Quotient) is approximately normal inType numbers in the boxes. shape with a mean of 100 and a standard deviation of 12. o points According to the standard deviation rule, % of people have an IQ between 76 and 124. Do not round. Question 12 Type numbers in the boxes. The distribution of IQ (Intelligence Quotient) is approximately normal in shape with a mean of 100 and...
 Please answer all of the following.
The boxplot below shows the number of contacts in their cell by gender for my Spring 2018 statistics classes. Using the boxplot, answer the 4 questions below. Boxplot of CellNumbers 900 800 700 600 500 400 300 200 100 0 Male Female Gender CellNumbers Which distribution has 3 outliers? Which distribution appears skewed right, excluding 1. Male 1 outliers? 2. Female Which distribution is 1 3. Both less variable (has the smaller IQR)? 4....
Please answer all of the following.
The boxplot below shows the number of contacts in their cell by gender for my Spring 2018 statistics classes. Using the boxplot, answer the 4 questions below. Boxplot of CellNumbers 900 800 700 600 500 400 300 200 100 0 Male Female Gender CellNumbers Which distribution has 3 outliers? Which distribution appears skewed right, excluding 1. Male 1 outliers? 2. Female Which distribution is 1 3. Both less variable (has the smaller IQR)? 4....
 Page 1 Question 1 Suppose we take repeated random samples of size 20 from a population with a Select all that apply. mean of 60 and a standard deviation of 8. Which of the following statements is 10 points true about the sampling distribution of the sample mean (x)? Check all that apply. A. The distribution is normal regardless of the shape of the population distribution, because the sample size is large enough. B. The distribution will be normal as...
 Please answer all parts of question. Thank you!
Discrete Probability Distributions: part 1 1. Consider the experiment of rolling two dice. a.) Define a random variable that takes on all possible values for the minimum value of the two dice face showing when the dice come to rest after the roll. b.) Before doing anything at all (do not write out the distribution yet), think about this experiment and the random variable. Tell me what you think the shape of...
Please answer all parts of question. Thank you!
Discrete Probability Distributions: part 1 1. Consider the experiment of rolling two dice. a.) Define a random variable that takes on all possible values for the minimum value of the two dice face showing when the dice come to rest after the roll. b.) Before doing anything at all (do not write out the distribution yet), think about this experiment and the random variable. Tell me what you think the shape of...
 please show the steps and formulas needed in order to
correctly answer each question. thank you in advance.
6) In a survey of 327 registered voters, 167 of them wished to see Mayor Waffleskate lose her next election. Find a point estimate for the proportion of registered voters who wish to see Mayor Waffleskate defeated 7) A survey of 800 women shoppers found that 17 % of them shop confidence interval for the true proportion of women shoppers who shop...
please show the steps and formulas needed in order to
correctly answer each question. thank you in advance.
6) In a survey of 327 registered voters, 167 of them wished to see Mayor Waffleskate lose her next election. Find a point estimate for the proportion of registered voters who wish to see Mayor Waffleskate defeated 7) A survey of 800 women shoppers found that 17 % of them shop confidence interval for the true proportion of women shoppers who shop...
 objective question
What is the mode and the mean for the following set of numbers? {4,9,8,2,16,4,4,8,9,6} O A. Mean = 7, mode =8 O B. Mean = 7, mode =4 O C. Mean = 6, mode =8 O D. Mean = 8, mode =9 You are conducting a survey of the people of the United Kingdom to find out how popular the racket sports are. You randomly choose people to call, and make 1,000 phone calls to people scattered across...
objective question
What is the mode and the mean for the following set of numbers? {4,9,8,2,16,4,4,8,9,6} O A. Mean = 7, mode =8 O B. Mean = 7, mode =4 O C. Mean = 6, mode =8 O D. Mean = 8, mode =9 You are conducting a survey of the people of the United Kingdom to find out how popular the racket sports are. You randomly choose people to call, and make 1,000 phone calls to people scattered across...
Most questions answered within 3 hours.
-
In the following reaction, which element is undergoing
oxidation: Na2SO3 + N2O --> N2 + Na2SO4...
asked 32 minutes ago -
Which of the following pairs of ions have the same electron
configuration?
I: Br− and Se2−...
asked 3 hours ago -
The Foremost Composite Materials Company is planning a two-day
sales conference for October 19-20. The conference...
asked 3 hours ago -
3) Illustrate the observed pattern of relatedness of organisms
versus adaptations to specific conditions. This means...
asked 3 hours ago -
In winter a lake has a 0.35 m thick ice layer over 1.10 m of
water....
asked 4 hours ago -
Assuming the following has been encrypted with a Vigenere cipher
below, use the method(s) and assumptions...
asked 5 hours ago -
How would I use switch statements to write a program that will
take an input of...
asked 4 hours ago -
Imagine a reaction in which methane gas combusts at a constant
pressure of 1 atm and...
asked 5 hours ago -
Two parallel wires (each 12 m in length) are separated by a
distance of 0.065 m...
asked 5 hours ago -
Suppose there were three masses at the corner of uniform
equilateral triangle. The masses are m1...
asked 5 hours ago -
Situation: A building that is 618 m above the ground floor. How
many times would a...
asked 5 hours ago -
help me and discuss one successful and one
unsuccessful international company/busines in Indonesia.whyit
succeed and why...
asked 5 hours ago