Will rate if everything is complete.
Homework Answers
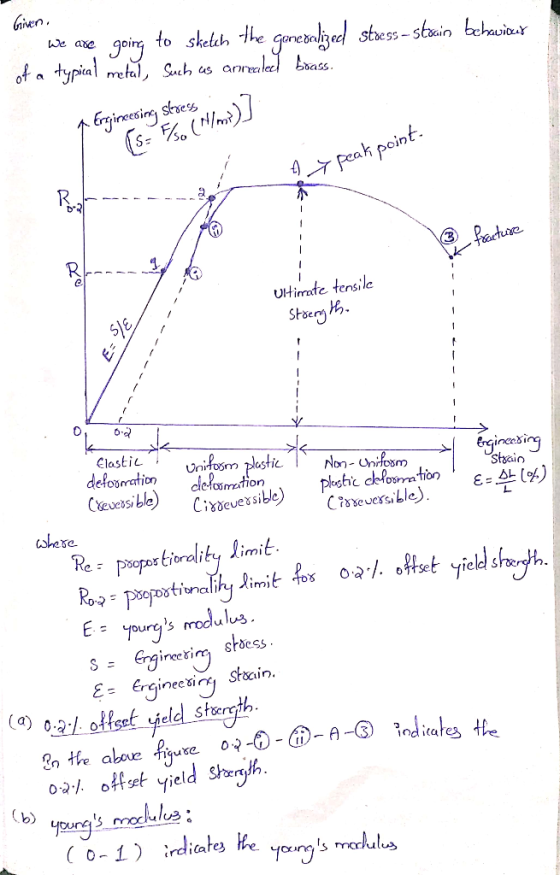
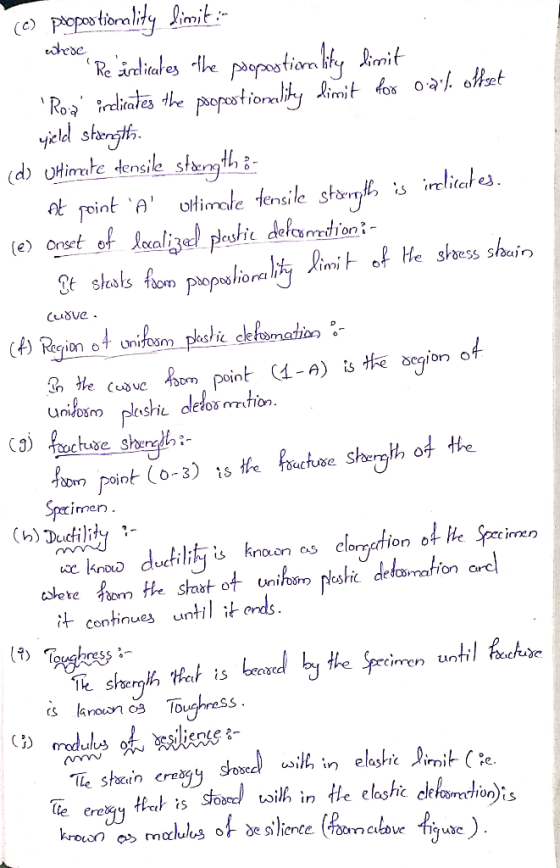
Given question is related to tensile test of a ductile material which is annealed brass.
The sub part of the questions are explained in a stress strain diagram of brass.
Which are clearly mentioned in the below image:
Add Answer to:
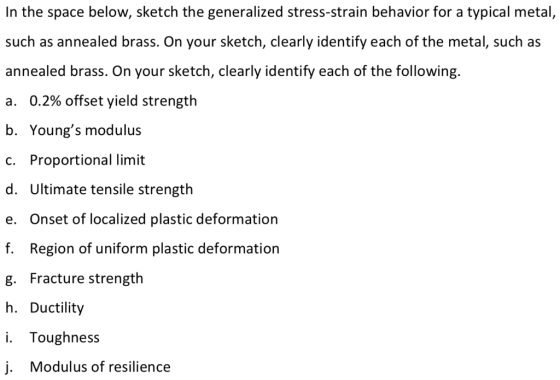
Will rate if everything is complete. In the space below, sketch the generalized stress-strain behavior for...
1.Below are stress-strain curves for 5 steels. (a) annealed low carbon steel, (b) a steel alloy...
 1.Below are stress-strain curves for 5 steels. (a) annealed low carbon steel, (b) a steel alloy which has a DBTT of +50°C (c) 304 stainless steel (d) nearly pure coarse grained Fe Identify the modulus, yield stress, tensile strength, ductility, and toughness. Identify the amount of elastic strain at yield stress, tensile strength, point right before fracture, point right after fracture. 2000 -Low C steel, 1800 steel alloy, DBTT +50C 304 stainless pure Fe 1600 1400 1200 t 1000 800...
manifactoring processes 1) Sketch Engineering stress vs. Engineering strain curve and True stress vs. true strain...
manifactoring processes 1) Sketch Engineering stress vs. Engineering strain curve and True stress vs. true strain curve from one uniaxial tension test for an engineering metals that shows power law strain hardening (e.g. aluminum or steel), within the same plot, and identify, from the curves, the material property parameters of: Yield strength (0.2% offset) Uniform engineering strain ultimate tensile strength (eng.) true stress and true strain at the onset of necking K and n from power-law fitting (the range of...
Figure 2.1 shows the stress strain curves for three materials. For these materials answer the fol...
 Figure 2.1 shows the stress strain curves for three materials. For these materials answer the following questions, giving reasons for your selection a) Which material has the highest elastic modulus? b) Which material has the highest ductility? c) Which material has the highest toughness? d) Which material has the highest yield strength? e) Which material has the highest ultimate tensile strength? f State respectively which material behaves like a: i. Metal ii. Polymer iii. Ceramic Figure 2.1 (NB. The points...
Q1 (10 points): Consider the two stress-strain curves shown to the right. Based on each of...
 Q1 (10 points): Consider the two stress-strain curves shown to the right. Based on each of these stress-strain curves, calculate or identify the following items: (a) • Modulus of elasticity Yield stress Yield strain Ultimate stress Ultimate strain Fracture stress Fracture strain • Ductility ratio Modulus of resilience Modulus of toughness u oo Stress (ksi) Straini 0.0012 0.0031 0.0039 0.0064 0.0079 O Note: If any of the values you need to identify or calculate are not explicitly clear from the...
5. EVALUATION I. Create a stress-strain diagram for the measured values in table 1 and identify...
 5. EVALUATION I. Create a stress-strain diagram for the measured values in table 1 and identify the mechanical properties of the material. (4 marks) II. Identify the following and label them in the graph. (12 marks) • Young's modulus Yield strength Elongation Ultimate tensile strength THEORETICAL BACKGROUND Equations: Cross-sectional Area (A) Modulus of Elasticity (E) Tensile Strength (ST) Percent Elongation (%EL) d? E = Sy Ey Sr Pu А %EL Extension at fracture Gauge Length Where: A: Cross- Sectional Area...
Try to make your answer short and clear to be easier for me to understand, please....
 Try
to make your answer short and clear to be easier for me to
understand, please. Thank you
Problem 1 (50 points) Stress Strain Curve Three steel bars with a diameter of 0.5 in, and carbon content of 0.2, 0.5, and 0.8%, respectively The specimens were subjected to tension until rupture. The load versus deformation results were as shown in the table below If the gauge length is 2 in., determine the following a. The tensile stresses and strains for...
Try
to make your answer short and clear to be easier for me to
understand, please. Thank you
Problem 1 (50 points) Stress Strain Curve Three steel bars with a diameter of 0.5 in, and carbon content of 0.2, 0.5, and 0.8%, respectively The specimens were subjected to tension until rupture. The load versus deformation results were as shown in the table below If the gauge length is 2 in., determine the following a. The tensile stresses and strains for...
please be very 100% sure before doing. thank you (1) (25 points) Load-elongation dataset were obtained...
 please be very 100% sure
before doing. thank you
(1) (25 points) Load-elongation dataset were obtained from a tensile test of high-strength steel as shown in the table. The test specimen had a diameter of 0.505 in. and a gage length of 2.00 in. The Poisson's ratio of high-strength steel is found to be 0.33 At fracture, the elongation between the gage marks was 0.12 in and the minimum diameter was 0.42 in 1) Plot the engineering stress-strain curve using...
please be very 100% sure
before doing. thank you
(1) (25 points) Load-elongation dataset were obtained from a tensile test of high-strength steel as shown in the table. The test specimen had a diameter of 0.505 in. and a gage length of 2.00 in. The Poisson's ratio of high-strength steel is found to be 0.33 At fracture, the elongation between the gage marks was 0.12 in and the minimum diameter was 0.42 in 1) Plot the engineering stress-strain curve using...
The graph below shows the stress vs. strain curves for thredifferent materials(A, 8, & c) obtaine...
 The graph below shows the stress vs. strain curves for thredifferent materials(A, 8, & c) obtained from a tensile test 3001 A 275 250 225 200 175 150 125 100 75 50 x-Break 25 0.00 0.01 002 0.03 004 005 0.06 007 0.08 0.09 0.10 Strain Using the curves above: a) Estimate the Young's Modulus for materials A, B, and C b) Estimate the yield strength and tensile strength (if any) of materials A, B, and C c) Using what...
could you please answer all these parts? 2) One scenario that has been examined in the...
 could you please answer all these parts?
2) One scenario that has been examined in the failure investigation of the Space Shuttle Columbia is the impact of a chunk of polyamide foam of mass of 1.211 kg, of dimensions of 0.508 m wide x 0.406 m long x 0.152 m tall, traveling at 457.3 m/s with a thermal heat-shielding tile, essentially composed of silica (SiO) A) (4 pts.) Calculate the kinetic energy with which the polyamide foam hit the silica...
could you please answer all these parts?
2) One scenario that has been examined in the failure investigation of the Space Shuttle Columbia is the impact of a chunk of polyamide foam of mass of 1.211 kg, of dimensions of 0.508 m wide x 0.406 m long x 0.152 m tall, traveling at 457.3 m/s with a thermal heat-shielding tile, essentially composed of silica (SiO) A) (4 pts.) Calculate the kinetic energy with which the polyamide foam hit the silica...
 1.Below are stress-strain curves for 5 steels. (a) annealed low carbon steel, (b) a steel alloy which has a DBTT of +50°C (c) 304 stainless steel (d) nearly pure coarse grained Fe Identify the modulus, yield stress, tensile strength, ductility, and toughness. Identify the amount of elastic strain at yield stress, tensile strength, point right before fracture, point right after fracture. 2000 -Low C steel, 1800 steel alloy, DBTT +50C 304 stainless pure Fe 1600 1400 1200 t 1000 800...
 Figure 2.1 shows the stress strain curves for three materials. For these materials answer the following questions, giving reasons for your selection a) Which material has the highest elastic modulus? b) Which material has the highest ductility? c) Which material has the highest toughness? d) Which material has the highest yield strength? e) Which material has the highest ultimate tensile strength? f State respectively which material behaves like a: i. Metal ii. Polymer iii. Ceramic Figure 2.1 (NB. The points...
 Q1 (10 points): Consider the two stress-strain curves shown to the right. Based on each of these stress-strain curves, calculate or identify the following items: (a) • Modulus of elasticity Yield stress Yield strain Ultimate stress Ultimate strain Fracture stress Fracture strain • Ductility ratio Modulus of resilience Modulus of toughness u oo Stress (ksi) Straini 0.0012 0.0031 0.0039 0.0064 0.0079 O Note: If any of the values you need to identify or calculate are not explicitly clear from the...
 5. EVALUATION I. Create a stress-strain diagram for the measured values in table 1 and identify the mechanical properties of the material. (4 marks) II. Identify the following and label them in the graph. (12 marks) • Young's modulus Yield strength Elongation Ultimate tensile strength THEORETICAL BACKGROUND Equations: Cross-sectional Area (A) Modulus of Elasticity (E) Tensile Strength (ST) Percent Elongation (%EL) d? E = Sy Ey Sr Pu А %EL Extension at fracture Gauge Length Where: A: Cross- Sectional Area...
 Try
to make your answer short and clear to be easier for me to
understand, please. Thank you
Problem 1 (50 points) Stress Strain Curve Three steel bars with a diameter of 0.5 in, and carbon content of 0.2, 0.5, and 0.8%, respectively The specimens were subjected to tension until rupture. The load versus deformation results were as shown in the table below If the gauge length is 2 in., determine the following a. The tensile stresses and strains for...
Try
to make your answer short and clear to be easier for me to
understand, please. Thank you
Problem 1 (50 points) Stress Strain Curve Three steel bars with a diameter of 0.5 in, and carbon content of 0.2, 0.5, and 0.8%, respectively The specimens were subjected to tension until rupture. The load versus deformation results were as shown in the table below If the gauge length is 2 in., determine the following a. The tensile stresses and strains for...
 please be very 100% sure
before doing. thank you
(1) (25 points) Load-elongation dataset were obtained from a tensile test of high-strength steel as shown in the table. The test specimen had a diameter of 0.505 in. and a gage length of 2.00 in. The Poisson's ratio of high-strength steel is found to be 0.33 At fracture, the elongation between the gage marks was 0.12 in and the minimum diameter was 0.42 in 1) Plot the engineering stress-strain curve using...
please be very 100% sure
before doing. thank you
(1) (25 points) Load-elongation dataset were obtained from a tensile test of high-strength steel as shown in the table. The test specimen had a diameter of 0.505 in. and a gage length of 2.00 in. The Poisson's ratio of high-strength steel is found to be 0.33 At fracture, the elongation between the gage marks was 0.12 in and the minimum diameter was 0.42 in 1) Plot the engineering stress-strain curve using...
 The graph below shows the stress vs. strain curves for thredifferent materials(A, 8, & c) obtained from a tensile test 3001 A 275 250 225 200 175 150 125 100 75 50 x-Break 25 0.00 0.01 002 0.03 004 005 0.06 007 0.08 0.09 0.10 Strain Using the curves above: a) Estimate the Young's Modulus for materials A, B, and C b) Estimate the yield strength and tensile strength (if any) of materials A, B, and C c) Using what...
 could you please answer all these parts?
2) One scenario that has been examined in the failure investigation of the Space Shuttle Columbia is the impact of a chunk of polyamide foam of mass of 1.211 kg, of dimensions of 0.508 m wide x 0.406 m long x 0.152 m tall, traveling at 457.3 m/s with a thermal heat-shielding tile, essentially composed of silica (SiO) A) (4 pts.) Calculate the kinetic energy with which the polyamide foam hit the silica...
could you please answer all these parts?
2) One scenario that has been examined in the failure investigation of the Space Shuttle Columbia is the impact of a chunk of polyamide foam of mass of 1.211 kg, of dimensions of 0.508 m wide x 0.406 m long x 0.152 m tall, traveling at 457.3 m/s with a thermal heat-shielding tile, essentially composed of silica (SiO) A) (4 pts.) Calculate the kinetic energy with which the polyamide foam hit the silica...
Most questions answered within 3 hours.
-
Why is Kevlar a stronger fabric then dacron? Provide two reasons
involving structures.
asked 8 minutes ago -
Suppose you have a checkers board. (8 squares wide and 8
squares long) and you
have...
asked 28 minutes ago -
Given the following function: QD = 200 - 5.25P
7.1 Derive the Regular Demand Function
7.2...
asked 22 minutes ago -
The following results were obtained as
part of a multiple regression analysis involving 3 independent
variables:...
asked 1 hour ago -
The time to complete a standardized exam is approximately normal
with a mean of 70 minutes...
asked 3 hours ago -
Two thousand randomly selected adults were asked whether or not
they have ever shopped on the...
asked 3 hours ago -
Estimate the diffusion coefficient for methyl phenyl sulfide in
water at 25 degrees Celcius.
asked 2 hours ago -
10.g of a certain metal absorb 40. cal of heat and the temperature
is abserved to...
asked 3 hours ago -
How many milliliters of 0.0695 M Ca( OH)
2would be required to exactly neutralize 176 mL...
asked 4 hours ago -
A telephone survey uses a random digit dialing machine to call
subjects. The random digit dialing...
asked 4 hours ago -
How can having too little or too much of a certain
protein cause problems for an...
asked 6 hours ago -
Assume a muscle has a PCSA = 20 cm2 and Lo = 12 cm. Assume it...
asked 7 hours ago