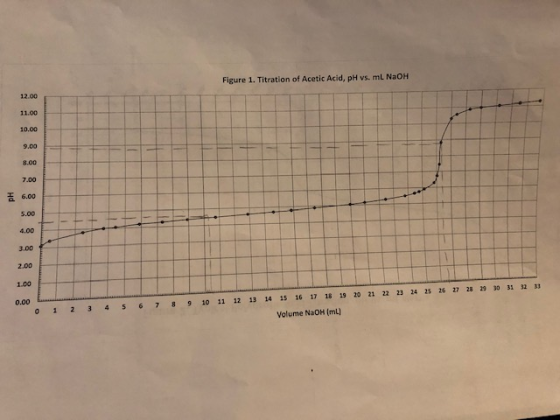
Review figure 1 of a student's experimental titration curve of 40.0ml of acetic acid with 0.1148 M NaOH. Based on the graph, determine the following:
1) The molarity of the acid
2) the Ka and pKa of the acid
Please provide step by step instructions on how to solve this problem.
Homework Answers

Add Answer to:
Review figure 1 of a student's experimental titration curve of 40.0ml of acetic acid with 0.1148...
Based on figure 2, the titration curve of 25.0 mL of phosphoric acid with 0.1082 M...
 Based on figure 2, the titration curve of 25.0 mL of phosphoric
acid with 0.1082 M NaOH, determine the following:
1) The molarity of the acid
2) the Ka1 and pKa1 of the acid
3) the Ka2 and pKa2 of the acid
Figure 2. Typical Polyprotic Acid Titration, pH vs. ml NaOH 12.00 Hd ml NaOH
Based on figure 2, the titration curve of 25.0 mL of phosphoric
acid with 0.1082 M NaOH, determine the following:
1) The molarity of the acid
2) the Ka1 and pKa1 of the acid
3) the Ka2 and pKa2 of the acid
Figure 2. Typical Polyprotic Acid Titration, pH vs. ml NaOH 12.00 Hd ml NaOH
Lab Report: Titration of Vinegar Experimental Data Trial 1 Trial 2 Initial Buret Reading Trial 3...
 Lab Report: Titration of Vinegar Experimental Data Trial 1 Trial 2 Initial Buret Reading Trial 3 OML OML OML Final Buret Reading 40 6 ML 40-3 ML 41-7 ML Volume of NaOH used 40.0ML 4 7 40.3 ML Molarity of NaOH used Volume of vinegar used 5ML SML 5ML Data Analysis 1. Write the balanced equation for the neutralization reaction between aqueous sodium hydroxide and acetic acid. The Molarity of Acetic Acid in Vinegar Trial 1 Trial 2 Trial 3...
α= 0.0 6. Sketch a plot below of a titration curve (pH vs volume of NaOH) when 25 mL of a 0.10N w...
 please help me plot/ and draw the curve (ph, pka, and
equivalence ph value)
α= 0.0 6. Sketch a plot below of a titration curve (pH vs volume of NaOH) when 25 mL of a 0.10N weak acid HA (Ka 1.00 X 10 is titrated with 0.10N strong base NaOH Indicate on the plot the initial pH, pha, 10% and 90% equivalence, equivalence, and final pH yalues.
α= 0.0 6. Sketch a plot below of a titration curve (pH vs...
please help me plot/ and draw the curve (ph, pka, and
equivalence ph value)
α= 0.0 6. Sketch a plot below of a titration curve (pH vs volume of NaOH) when 25 mL of a 0.10N weak acid HA (Ka 1.00 X 10 is titrated with 0.10N strong base NaOH Indicate on the plot the initial pH, pha, 10% and 90% equivalence, equivalence, and final pH yalues.
α= 0.0 6. Sketch a plot below of a titration curve (pH vs...
1.Draw the pH titration curve for the titration of 35 mL of 0.150 M acetic acid with 0.200 M NaOH. Include the pH v...
 1.Draw the pH titration curve for the titration of 35 mL of 0.150 M acetic acid with 0.200 M NaOH. Include the pH values and NaOH volume requested below on your pH titration curve. Also, put on the curve the species that dictates the pH at the requested pH values. For acetic acid, K = 1.8 x 10%. 1) the initial pH 2) the pH after 15.0 mL of NaOH have been added 3) the volume of NaOH at the...
2) Titration of acetic acid using indicator and pH meter Trial 1 oo Mass of empty...
 2) Titration of acetic acid using indicator and pH meter Trial 1 oo Mass of empty beaker Mass of beaker + acetic acid solution 51.585 80,863 oo Mass of acetic acid solution oo Volume of acetic acid solution mL Record your titration data in the table below. Measure _pH 9.5 54 Vol. of NaOH Vol. of NaOH Measured Vol. of NaOH 1 Vol. of NaOH in buret (mL) added (mL) in buret (mL) added (mL) pH 0.00 248 5.24 10.0...
Part A: Calculating a Theoretical Titration Curve (Weak Acid - Strong Base) Consider the titration of...
 Part A: Calculating a Theoretical Titration Curve (Weak Acid - Strong Base) Consider the titration of 50.00 mL of 0.05 M acetic acid with 0.1 M NaOH. Calculate the pH of the resulting solution at the following points during the titration (given as volume of NaOH added). Volume NaOH pH of analyte 0.00 15.00 20.00 24.00 24.50 mL at equivalence point 40.00
(6) 24. Draw the rough titration curve of 20.0mL of 0.100M acetic acid (Ka = 1.8...
 (6) 24. Draw the rough titration curve of 20.0mL of 0.100M acetic acid (Ka = 1.8 x 10⁻⁵) being titrated with 0.100M NaOH. Calculate and label the: I. Initial pH II. pKa, 1/4-equivalence point, 3/4 equivalence point III. Equivalence point Be sure to label the axes and show your work.
I'm not sure how to solve this! Any help is appreciated! 1.Draw the pH titration curve...
 I'm not sure how to solve this! Any help is
appreciated!
1.Draw the pH titration curve for the titration of 35 mL of 0.150 M acetic acid with 0.200 m Include the pH values and NaOH volume requested below on your pH titration curve. Al curve the species that dictates the pH at the requested pH values. For acetic acid, Ka = 1.885 in your pH titration curve. Also, put on the 1) the initial pH 2) the pH after...
I'm not sure how to solve this! Any help is
appreciated!
1.Draw the pH titration curve for the titration of 35 mL of 0.150 M acetic acid with 0.200 m Include the pH values and NaOH volume requested below on your pH titration curve. Al curve the species that dictates the pH at the requested pH values. For acetic acid, Ka = 1.885 in your pH titration curve. Also, put on the 1) the initial pH 2) the pH after...
Exp data given o Graph a Titration curve (can be done using excel or hand drawn...
 Exp
data given
o Graph a Titration curve (can be done using excel or hand drawn on graph paper) o Use the titration curve to find pH at the equivalence point - pka of Acetic acid compare the experimental the accuracy of the titration (for the pka value) X100% Imean experimental value - actual value Actual value Note: pka = -log, Questions 1) Define pH 2) Define pka Volume NaOH added (ml) pH 2 3.4 3 3 .7 43.9 54...
Exp
data given
o Graph a Titration curve (can be done using excel or hand drawn on graph paper) o Use the titration curve to find pH at the equivalence point - pka of Acetic acid compare the experimental the accuracy of the titration (for the pka value) X100% Imean experimental value - actual value Actual value Note: pka = -log, Questions 1) Define pH 2) Define pka Volume NaOH added (ml) pH 2 3.4 3 3 .7 43.9 54...
1. The following graph is provided for the titration of 10.00 mL benzoic acid solution with...
 1. The following graph is provided for the titration of 10.00 mL benzoic acid solution with a strong base. The concentration of NaOH is 0.100 M. A. Based on this graph given below, determine the Ka. B. Determine the molarity of the acid. Benzoic acid titration with 0.1 M NaOH 12.00 10.00 8.00 pH 6.00 4.00 2.00 0.00 0.00 5.00 10.00 15.00 Volume of NaOH mL
 Based on figure 2, the titration curve of 25.0 mL of phosphoric
acid with 0.1082 M NaOH, determine the following:
1) The molarity of the acid
2) the Ka1 and pKa1 of the acid
3) the Ka2 and pKa2 of the acid
Figure 2. Typical Polyprotic Acid Titration, pH vs. ml NaOH 12.00 Hd ml NaOH
Based on figure 2, the titration curve of 25.0 mL of phosphoric
acid with 0.1082 M NaOH, determine the following:
1) The molarity of the acid
2) the Ka1 and pKa1 of the acid
3) the Ka2 and pKa2 of the acid
Figure 2. Typical Polyprotic Acid Titration, pH vs. ml NaOH 12.00 Hd ml NaOH
 Lab Report: Titration of Vinegar Experimental Data Trial 1 Trial 2 Initial Buret Reading Trial 3 OML OML OML Final Buret Reading 40 6 ML 40-3 ML 41-7 ML Volume of NaOH used 40.0ML 4 7 40.3 ML Molarity of NaOH used Volume of vinegar used 5ML SML 5ML Data Analysis 1. Write the balanced equation for the neutralization reaction between aqueous sodium hydroxide and acetic acid. The Molarity of Acetic Acid in Vinegar Trial 1 Trial 2 Trial 3...
 please help me plot/ and draw the curve (ph, pka, and
equivalence ph value)
α= 0.0 6. Sketch a plot below of a titration curve (pH vs volume of NaOH) when 25 mL of a 0.10N weak acid HA (Ka 1.00 X 10 is titrated with 0.10N strong base NaOH Indicate on the plot the initial pH, pha, 10% and 90% equivalence, equivalence, and final pH yalues.
α= 0.0 6. Sketch a plot below of a titration curve (pH vs...
please help me plot/ and draw the curve (ph, pka, and
equivalence ph value)
α= 0.0 6. Sketch a plot below of a titration curve (pH vs volume of NaOH) when 25 mL of a 0.10N weak acid HA (Ka 1.00 X 10 is titrated with 0.10N strong base NaOH Indicate on the plot the initial pH, pha, 10% and 90% equivalence, equivalence, and final pH yalues.
α= 0.0 6. Sketch a plot below of a titration curve (pH vs...
 1.Draw the pH titration curve for the titration of 35 mL of 0.150 M acetic acid with 0.200 M NaOH. Include the pH values and NaOH volume requested below on your pH titration curve. Also, put on the curve the species that dictates the pH at the requested pH values. For acetic acid, K = 1.8 x 10%. 1) the initial pH 2) the pH after 15.0 mL of NaOH have been added 3) the volume of NaOH at the...
 2) Titration of acetic acid using indicator and pH meter Trial 1 oo Mass of empty beaker Mass of beaker + acetic acid solution 51.585 80,863 oo Mass of acetic acid solution oo Volume of acetic acid solution mL Record your titration data in the table below. Measure _pH 9.5 54 Vol. of NaOH Vol. of NaOH Measured Vol. of NaOH 1 Vol. of NaOH in buret (mL) added (mL) in buret (mL) added (mL) pH 0.00 248 5.24 10.0...
 Part A: Calculating a Theoretical Titration Curve (Weak Acid - Strong Base) Consider the titration of 50.00 mL of 0.05 M acetic acid with 0.1 M NaOH. Calculate the pH of the resulting solution at the following points during the titration (given as volume of NaOH added). Volume NaOH pH of analyte 0.00 15.00 20.00 24.00 24.50 mL at equivalence point 40.00
 (6) 24. Draw the rough titration curve of 20.0mL of 0.100M acetic acid (Ka = 1.8 x 10⁻⁵) being titrated with 0.100M NaOH. Calculate and label the: I. Initial pH II. pKa, 1/4-equivalence point, 3/4 equivalence point III. Equivalence point Be sure to label the axes and show your work.
 I'm not sure how to solve this! Any help is
appreciated!
1.Draw the pH titration curve for the titration of 35 mL of 0.150 M acetic acid with 0.200 m Include the pH values and NaOH volume requested below on your pH titration curve. Al curve the species that dictates the pH at the requested pH values. For acetic acid, Ka = 1.885 in your pH titration curve. Also, put on the 1) the initial pH 2) the pH after...
I'm not sure how to solve this! Any help is
appreciated!
1.Draw the pH titration curve for the titration of 35 mL of 0.150 M acetic acid with 0.200 m Include the pH values and NaOH volume requested below on your pH titration curve. Al curve the species that dictates the pH at the requested pH values. For acetic acid, Ka = 1.885 in your pH titration curve. Also, put on the 1) the initial pH 2) the pH after...
 Exp
data given
o Graph a Titration curve (can be done using excel or hand drawn on graph paper) o Use the titration curve to find pH at the equivalence point - pka of Acetic acid compare the experimental the accuracy of the titration (for the pka value) X100% Imean experimental value - actual value Actual value Note: pka = -log, Questions 1) Define pH 2) Define pka Volume NaOH added (ml) pH 2 3.4 3 3 .7 43.9 54...
Exp
data given
o Graph a Titration curve (can be done using excel or hand drawn on graph paper) o Use the titration curve to find pH at the equivalence point - pka of Acetic acid compare the experimental the accuracy of the titration (for the pka value) X100% Imean experimental value - actual value Actual value Note: pka = -log, Questions 1) Define pH 2) Define pka Volume NaOH added (ml) pH 2 3.4 3 3 .7 43.9 54...
 1. The following graph is provided for the titration of 10.00 mL benzoic acid solution with a strong base. The concentration of NaOH is 0.100 M. A. Based on this graph given below, determine the Ka. B. Determine the molarity of the acid. Benzoic acid titration with 0.1 M NaOH 12.00 10.00 8.00 pH 6.00 4.00 2.00 0.00 0.00 5.00 10.00 15.00 Volume of NaOH mL
Most questions answered within 3 hours.
-
The fuel economy of a 2011 Lexus RX 350 2wd 6 cylinder 3.5 L
automatic 5...
asked 2 minutes ago -
i.
the synthesized compund 2-bromo-butanal i have a IR peak at about
3200 and one at...
asked 2 minutes ago -
A
752 mL sample of water was placed in a 1000 gram pan of aluminum.
The...
asked 13 minutes ago -
1.In the context of chelation, what does binding strength mean?
What happens at the molecular level...
asked 6 minutes ago -
Describe two obstacles that makes fixing atmospheric nitrogen
difficult.
asked 25 minutes ago -
Evelyn incorporates her sole proprietorship, transferring it to
newly formed Papaya Corporation. The assets transferred have...
asked 12 minutes ago -
Assume that in a hydrogen atom, the electron circles the nucleus
in a circle of radius...
asked 20 minutes ago -
1 point) Given the significance level α=0.01 find the following:
(a) left-tailed z value z= (b)...
asked 15 minutes ago -
Calculate the expected value, the variance, and the standard
deviation of the given random variable X....
asked 16 minutes ago -
T
F 53) Most differences
between human groups are the result of biology rather than
culture....
asked 30 minutes ago -
A 5.20 mW helium neon laser emits a visible laser beam with a
wavelength of 633...
asked 33 minutes ago -
Assignment:
Your
organization has made a strategic decision
to
outsourcework
currently performed in house. You have...
asked 32 minutes ago