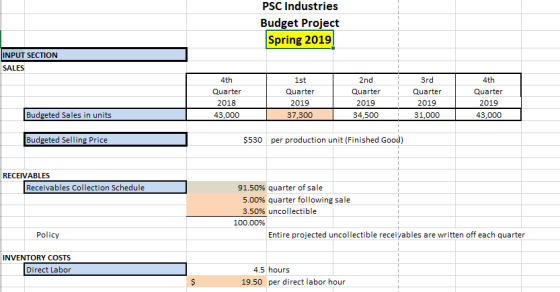
create the initial documents for the master budget:
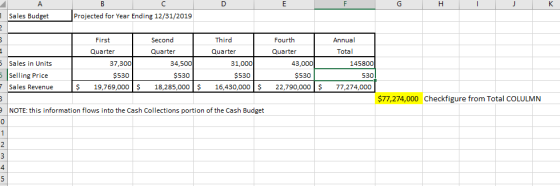
• sales budget
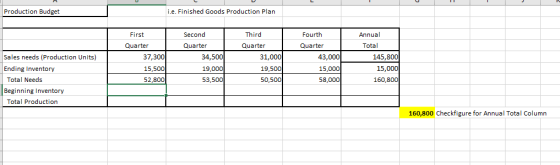
• production budget
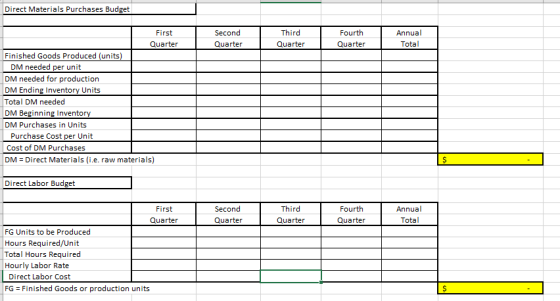
• direct materials purchases budget
• direct labor budget
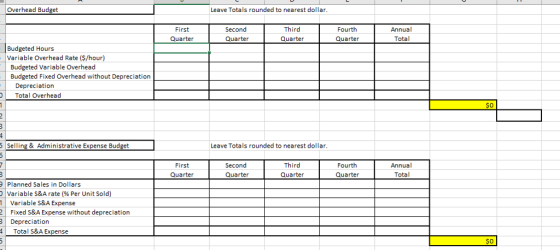
• overhead budget
• selling and administrative expense budget
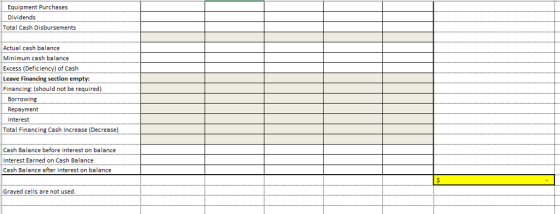
• cash budget include a schedule of cash collections and payments
• finished goods inventory calculation
Then, Create the following schedules, financial statements, and
calculations
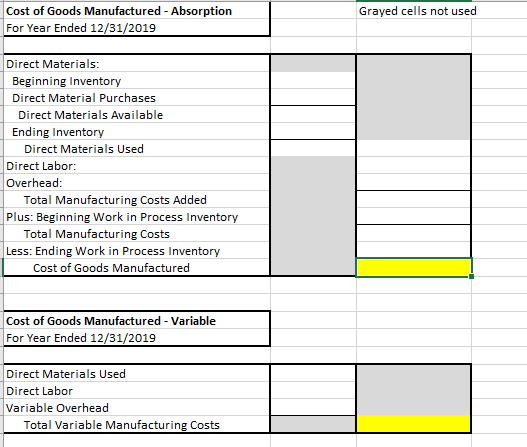
A) Pro forma cost of goods manufactured
B) Pro forma Cost of goods sold- both financial and variable cost basis
C) Pro forma income statement (financial basis)
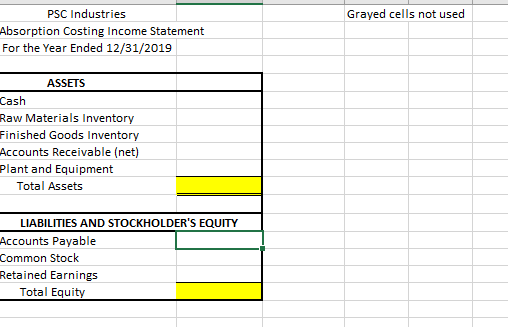
D) Pro forma balance sheet
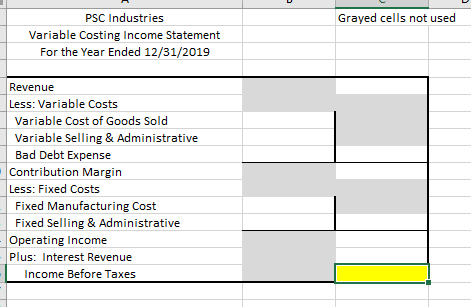
E)Pro forma Income statement (variable cost basis)
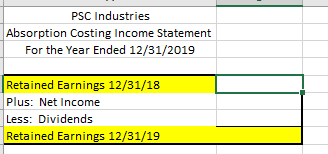
F) Pro forma statement of retained earnings
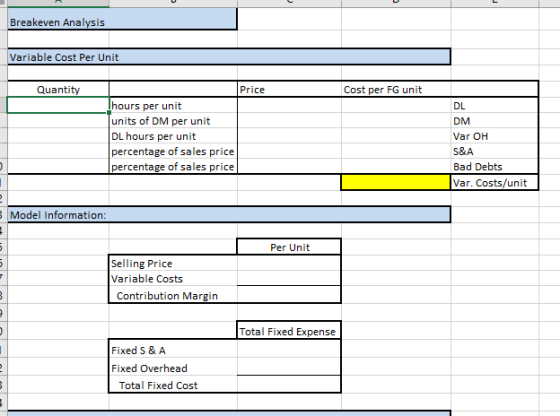
G) breakeven analysis: 1. breakeven sales level in units and dollars. 2. cost volume profit graph showing the breakeven point
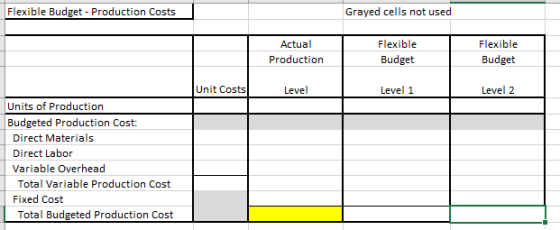
H) Flexible Budget
1. Create the flecxible budget results for production costs as if actual production were 160,000 units in the first quarter of 2019
2. Add flexible budget results for slightly higher and slightly lower production at 170,000 units and 150,000 units, respectively.


Here is the template for everything


Homework Answers
Solution:
Part 1 – Production Budget
|
Production Budget |
|||||
|
First Quarter |
Second Quarter |
Third Quarter |
Fourth Quarter |
Annual |
|
|
Sales needs (Production units) |
37300 |
34500 |
31000 |
43000 |
145800 |
|
Plus: Desired Ending Finished Goods Inventory |
15500 |
19000 |
19500 |
15000 |
15000 |
|
Total Needs |
52800 |
53500 |
50500 |
58000 |
160800 |
|
Less: Estimated Beginning Finished Goods Inventory |
0 |
15500 |
19000 |
19500 |
0 |
|
Required Production in Units |
52800 |
38000 |
31500 |
38500 |
160800 |
Part 2 – Direct materials purchase budget
|
Raw Materials Budget |
|||||
|
First quarter |
Second quarter |
Third Quarter |
Fourth Quarter |
Annual |
|
|
Finished goods produced (units) |
52,800 |
38,000 |
31,500 |
38,500 |
160,800 |
|
DM needed per unit |
3 |
3 |
3 |
3 |
3 |
|
Direct materials needed for production |
158400 |
114000 |
94500 |
115500 |
482400 |
|
Plus: Desired Raw Material Ending Inventory (25% of next month's production needs) |
28500 |
23625 |
28875 |
26000 |
26000 |
|
Total direct materials needed |
186900 |
137625 |
123375 |
141500 |
508400 |
|
Less: Estimated Beginning Raw materials Inventory |
28436 |
28500 |
23625 |
28875 |
28436 |
|
Budgeted Raw Materials purchases in units |
158464 |
109125 |
99750 |
112625 |
479964 |
|
Direct materials cost per unit |
$84.25 |
$84.25 |
$84.25 |
$84.25 |
$84.25 |
|
Budgeted cost of direct materials |
$13,350,592.00 |
$9,193,781.25 |
$8,403,937.50 |
$9,488,656.25 |
$40,436,967.00 |
Part 3 – Direct labor budget
|
Direct Labor Budget |
|||||
|
Quarter 1 |
Quarter 2 |
Quarter 3 |
Quarter 4 |
Annual |
|
|
FG Units to be produced |
52,800 |
38,000 |
31,500 |
38,500 |
|
|
Required Direct Labor Hour per unit |
4.50 |
4.50 |
4.50 |
4.50 |
|
|
Total Direct Labor Hours Required |
237,600 |
171,000 |
141,750 |
173,250 |
|
|
Direct Labor Cost per hour |
$19.5 |
$19.5 |
$19.5 |
$19.5 |
|
|
Budgeted Direct Labor Cost |
$4,633,200 |
$3,334,500 |
$2,764,125 |
$3,378,375 |
$14,110,200 |
Part 4 – Overhead Budget
|
Overhead Budget |
|||||
|
First quarter |
Second quarter |
third quarter |
fourth quarter |
Annual |
|
|
Budgeted Hours |
237600 |
171000 |
141750 |
173250 |
|
|
Variable overhead rate ($/Hour) |
$9.50 |
$9.50 |
$9.50 |
$9.50 |
|
|
Budgeted Variable Overhead |
$2,257,200 |
$1,624,500 |
$1,346,625 |
$1,645,875 |
|
|
Budgeted Fixed Overhead without Depreciation |
$915,000 |
$915,000 |
$915,000 |
$915,000 |
|
|
Depreciation |
$326,000 |
$326,000 |
$326,000 |
$326,000 |
|
|
Total Overhead |
$3,498,200 |
$2,865,500 |
$2,587,625 |
$2,886,875 |
$11,838,200 |
Hope the above calculations, working and explanations are clear to you and help you in understanding the concept of question.... please rate my answer...in case any doubt, post a comment and I will try to resolve the doubt ASAP…thank you
Pls ask separate question for remaining parts
Add Answer to:
create the initial documents for the master budget: • sales budget • production budget • direct...
Create These budgets: -selling and administrative expense budget -cash budget include a schedule of cash collections...
 Create These budgets:
-selling and administrative expense budget
-cash budget include a schedule of cash collections and
payments
-finished goods inventory calculation
Then, Create the following schedules, financial statements, and
calculations
A) Pro forma cost of goods manufactured
B) Pro forma Cost of goods sold- both financial and variable
cost basis
C) Pro forma income statement (financial basis)
D) Pro forma balance sheet
E)Pro forma Income statement (variable cost basis)
F) Pro forma statement of retained earnings
G) breakeven analysis:...
Create These budgets:
-selling and administrative expense budget
-cash budget include a schedule of cash collections and
payments
-finished goods inventory calculation
Then, Create the following schedules, financial statements, and
calculations
A) Pro forma cost of goods manufactured
B) Pro forma Cost of goods sold- both financial and variable
cost basis
C) Pro forma income statement (financial basis)
D) Pro forma balance sheet
E)Pro forma Income statement (variable cost basis)
F) Pro forma statement of retained earnings
G) breakeven analysis:...
Please prepare a production budget with the following master budget information: Projected unit sales for each...
Please prepare a production budget with the following master budget information: Projected unit sales for each quarter for 2013 are as follows: Quarter 1 60,000 Quarter 2 70,000 Quarter 3 80,000 Quarter 4 65,000 The selling price is $500 per unit. All sales are on credit (no cash sales). 70% of all sales are collected within the quarter they are sold. The other 30% are collected in the following quarter. There are no bad debts. There is no beginning inventory...
Operating Budget, Comprehensive Analysis Allison Manufacturing produces a subassembly used in the production of jet aircraft...
Operating Budget, Comprehensive Analysis Allison Manufacturing produces a subassembly used in the production of jet aircraft engines. The assembly is sold to engine manufacturers and aircraft maintenance facilities. Projected sales in units for the coming 5 months follow: January 40,000 February 50,000 March 60,000 April 60,000 May 62,000 The following data pertain to production policies and manufacturing specifications followed by Allison Manufacturing: Finished goods inventory on January 1 is 32,000 units, each costing $166.06. The desired ending inventory for each...
CHAPTER 8! MASTER DUDUL IN-CLASS PRACTICE PROBLEM - SALES BUDGET TO MANUFACTURING OVERHEAD BUDGET (SCHEDULES 1-10)...
 CHAPTER 8! MASTER DUDUL IN-CLASS PRACTICE PROBLEM - SALES BUDGET TO MANUFACTURING OVERHEAD BUDGET (SCHEDULES 1-10) The following information pertains to the budgeting process for Tulip, Inc. SALES: Tulip, Inc. sell one type of decorative basket for $25 per basket. Based on various sales forecasting models, Tulip expects to sell 11.000 units in quarter 1. 10,000 in quarter 2, 12,000 in quarter 3 and 9,000 in quarter 4. The beginning accounts receivable balance was $58,000. Assuming all sales are made...
SarasotaCompany is preparing its master budget for 2017. Relevant data pertaining to its sales, production, and...
 SarasotaCompany is preparing its master budget for 2017. Relevant data pertaining to its sales, production, and direct materials budgets are as follows. Sales. Sales for the year are expected to total 1,200,000 units. Quarterly sales are 18%, 25%, 23%, and 34%, respectively. The sales price is expected to be $38 per unit for the first three quarters and $47 per unit beginning in the fourth quarter. Sales in the first quarter of 2018 are expected to be 10% higher than...
preparing a master budget practice Schedules to include: a. Sales Budget, with a Schedule of Expected Cash Coll...
 preparing a master budget practice
Schedules to include: a. Sales Budget, with a Schedule of Expected Cash Collections b. Production Budget C. Ending Finished Goods Inventory Budget d. Direct Materials Budget, with a Schedule of Cash Disbursement e. Direct Labor Budget f. Manufacturing Overhead Budget g. Selling & Administrative Expense Budget h. Cash Budget i. Budgeted Income Statement Sharp Products is a manufacturing company. It uses absorption costing for budgeting. amount unit Budgeted sales: Q1 of 2019 23,000 cases Q2...
preparing a master budget practice
Schedules to include: a. Sales Budget, with a Schedule of Expected Cash Collections b. Production Budget C. Ending Finished Goods Inventory Budget d. Direct Materials Budget, with a Schedule of Cash Disbursement e. Direct Labor Budget f. Manufacturing Overhead Budget g. Selling & Administrative Expense Budget h. Cash Budget i. Budgeted Income Statement Sharp Products is a manufacturing company. It uses absorption costing for budgeting. amount unit Budgeted sales: Q1 of 2019 23,000 cases Q2...
Operating Budget, Comprehensive Analysis Allison Manufacturing produces a subassembly used in the production of jet aircraft...
 Operating Budget, Comprehensive Analysis Allison Manufacturing produces a subassembly used in the production of jet aircraft engines. The assembly is sold to engine manufacturers and aircraft maintenance facilities. Projected sales in units for the coming 5 months follow: January 40,000 February 50,000 March 60,000 April 60,000 May 62,000 The following data pertain to production policies and manufacturing specifications followed by Allison Manufacturing: 1 a. Finished goods inventory on January 1 is 32,000 units, each costing $166.06. The desired ending inventory...
Waterways Corporation is preparing its budget for the coming year, 2020. The first step is to plan for the first quarter of that coming year. The company has gathered information from its managers in preparation of the budgeting process.
SalesUnit sales for November 2019114,000Unit sales for December 2019103,000Expected unit sales for January 2020114,000Expected unit sales for February 2020111,000Expected unit sales for March 2020116,000Expected unit sales for April 2020125,000Expected unit sales for May 2020136,000Unit selling price$12Waterways likes to keep 10% of the next month’s unit sales in ending inventory. All sales are on account. 85% of the Accounts Receivable are collected in the month of sale, and 15% of the Accounts Receivable are collected in the month after sale. Accounts...
Operating Budget, Comprehensive Analysis Ponderosa, Inc., produces wiring harness assemblies used in the production of semi-trailer...
Operating Budget, Comprehensive Analysis Ponderosa, Inc., produces wiring harness assemblies used in the production of semi-trailer trucks. The wiring harness assemblies are sold to various truck manufacturers around the world. Projected sales in units for the coming five months are given below. January 10,000 February 10,500 March 13,100 April 16,000 May 18,500 The following data pertain to production policies and manufacturing specifications followed by Ponderosa: Finished goods inventory on January 1 is 900 units. The desired ending inventory for each...
Okay Company is preparing to build its master budget. The budget will detail each quarter's activity and the activity for the year in total.
 Master Budget ProjectOkay Company is preparing to build its master budget. The budget will detail each quarter's activity and the activity for the year in total. The master budget will be based on the following information:a. This will be the first year of operation for Okay Company.b. Budgeted unit sales by quarter for 2017 are projected as follows: First quarter 6,300 , Second quarter 6,100 , Third quarter 6,100 & Fourth quarter 6,450 . First and second quarter 2018 budgeted...
 Create These budgets:
-selling and administrative expense budget
-cash budget include a schedule of cash collections and
payments
-finished goods inventory calculation
Then, Create the following schedules, financial statements, and
calculations
A) Pro forma cost of goods manufactured
B) Pro forma Cost of goods sold- both financial and variable
cost basis
C) Pro forma income statement (financial basis)
D) Pro forma balance sheet
E)Pro forma Income statement (variable cost basis)
F) Pro forma statement of retained earnings
G) breakeven analysis:...
Create These budgets:
-selling and administrative expense budget
-cash budget include a schedule of cash collections and
payments
-finished goods inventory calculation
Then, Create the following schedules, financial statements, and
calculations
A) Pro forma cost of goods manufactured
B) Pro forma Cost of goods sold- both financial and variable
cost basis
C) Pro forma income statement (financial basis)
D) Pro forma balance sheet
E)Pro forma Income statement (variable cost basis)
F) Pro forma statement of retained earnings
G) breakeven analysis:...
 CHAPTER 8! MASTER DUDUL IN-CLASS PRACTICE PROBLEM - SALES BUDGET TO MANUFACTURING OVERHEAD BUDGET (SCHEDULES 1-10) The following information pertains to the budgeting process for Tulip, Inc. SALES: Tulip, Inc. sell one type of decorative basket for $25 per basket. Based on various sales forecasting models, Tulip expects to sell 11.000 units in quarter 1. 10,000 in quarter 2, 12,000 in quarter 3 and 9,000 in quarter 4. The beginning accounts receivable balance was $58,000. Assuming all sales are made...
 SarasotaCompany is preparing its master budget for 2017. Relevant data pertaining to its sales, production, and direct materials budgets are as follows. Sales. Sales for the year are expected to total 1,200,000 units. Quarterly sales are 18%, 25%, 23%, and 34%, respectively. The sales price is expected to be $38 per unit for the first three quarters and $47 per unit beginning in the fourth quarter. Sales in the first quarter of 2018 are expected to be 10% higher than...
 preparing a master budget practice
Schedules to include: a. Sales Budget, with a Schedule of Expected Cash Collections b. Production Budget C. Ending Finished Goods Inventory Budget d. Direct Materials Budget, with a Schedule of Cash Disbursement e. Direct Labor Budget f. Manufacturing Overhead Budget g. Selling & Administrative Expense Budget h. Cash Budget i. Budgeted Income Statement Sharp Products is a manufacturing company. It uses absorption costing for budgeting. amount unit Budgeted sales: Q1 of 2019 23,000 cases Q2...
preparing a master budget practice
Schedules to include: a. Sales Budget, with a Schedule of Expected Cash Collections b. Production Budget C. Ending Finished Goods Inventory Budget d. Direct Materials Budget, with a Schedule of Cash Disbursement e. Direct Labor Budget f. Manufacturing Overhead Budget g. Selling & Administrative Expense Budget h. Cash Budget i. Budgeted Income Statement Sharp Products is a manufacturing company. It uses absorption costing for budgeting. amount unit Budgeted sales: Q1 of 2019 23,000 cases Q2...
 Operating Budget, Comprehensive Analysis Allison Manufacturing produces a subassembly used in the production of jet aircraft engines. The assembly is sold to engine manufacturers and aircraft maintenance facilities. Projected sales in units for the coming 5 months follow: January 40,000 February 50,000 March 60,000 April 60,000 May 62,000 The following data pertain to production policies and manufacturing specifications followed by Allison Manufacturing: 1 a. Finished goods inventory on January 1 is 32,000 units, each costing $166.06. The desired ending inventory...
 Master Budget ProjectOkay Company is preparing to build its master budget. The budget will detail each quarter's activity and the activity for the year in total. The master budget will be based on the following information:a. This will be the first year of operation for Okay Company.b. Budgeted unit sales by quarter for 2017 are projected as follows: First quarter 6,300 , Second quarter 6,100 , Third quarter 6,100 & Fourth quarter 6,450 . First and second quarter 2018 budgeted...
Most questions answered within 3 hours.
-
last question i found wrong so downvoted so dont copy
paste or dont try if you...
asked 52 seconds ago -
A block sits on the floor. (a) What is the magnitude of the
frictional force on...
asked 24 minutes ago -
True or False: Spinal nerves emerging from the vertebral column
are ONLY motor OR sensory.
Select...
asked 5 minutes ago -
Thanks so much for the help! Please show all work.
A uniform solid disk with radius...
asked 4 minutes ago -
Please use Logicly!
Create a 4 bit sequential counter that is capable of counting up
or...
asked 13 minutes ago -
I1(t) and I2(t) describe the intensity of two
light waves.
I1(t)= 10sin(30t+π/4)
I2(t)=
10sin(30.4t+π)
Assume that...
asked 18 minutes ago -
A sample of steam with a mass of 0.501 g at a temperature of 100
∘C...
asked 23 minutes ago -
state one specific part from disability law such as ADA
(Americans with Disability Acts) or policy...
asked 25 minutes ago -
please simplify how vapor pressure lowering is related to a
rise in the boiling point solution
asked 39 minutes ago -
write a java program that does the following
Part one
Use a For loop to compute...
asked 37 minutes ago -
"A student in another class made a claim that many people are
now talking about outlawing...
asked 39 minutes ago -
Test the hypothesis using P-value approach. Be sure to verify
the requirements of the test.
H0:...
asked 1 hour ago