Homework Answers
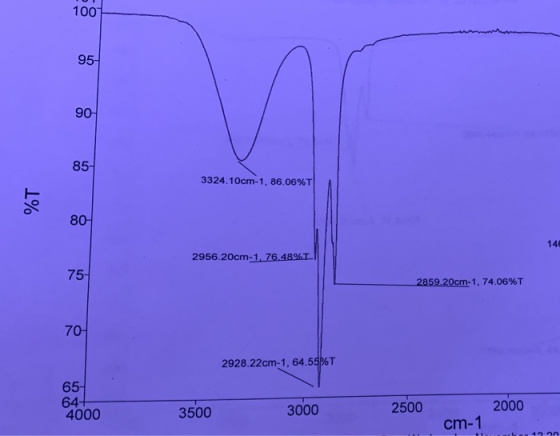
The attached IR spectra has only few signals. But these are most characteristic signals. So now we will discuss about these signals and write the details in the given table.
IR spectral details:
- At 3324 cm-1 there is a very broad signal which is more prominent and characteristic stretching signal of O-H bond vibration frequencies. Therefore, there must be a hydroxyl (-OH alcohol) group in the compound
- There -OH group does not belongs to any acid but it belongs to an alcohol compound.
- One more important signal which present around 2928 cm-1 region. This signal is corresponding to the C-H stretch of sp3 hybridized carbon. So, there is a -CH2- or -CH3 groups present in the compound along with hydroxyl group.
- There is one more signal at 2859 cm-1 which is corresponding to the C-H sp2 stretch. So, we may have doubly bonded carbon here.
So, if we observe, overall, the compound is a alcohol. The filled table with all given IR details given below:

Add Answer to:
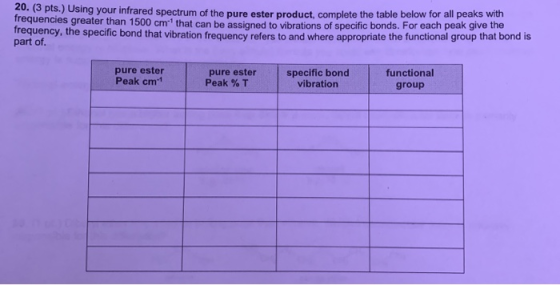
Please complete the table given the following IR spectrum! Thank you! 3324.10cm-1.86.06%T 1% 2956.20cm-1, 76.48% !...
1-Pentanol Ndoo 380m .95.3144 1114.834m 19017 1378.31cm-1. ppcm-1,6 3319.13cm.1, 85 67%T %T 1463 27cm-1.06.20%T 17 728.700m-1.16...
 1-Pentanol Ndoo 380m .95.3144 1114.834m 19017 1378.31cm-1. ppcm-1,6 3319.13cm.1, 85 67%T %T 1463 27cm-1.06.20%T 17 728.700m-1.16 21% 1075.28671.81 65%T 2863.37cm-1, 77.98%T 1005cm-1.78.20%T 2956 260m-1.77.52 29:30.260m-1.00.35% 1053.7 m 1,606157 1000650 3500 3000 2000 1500 2500 cm-1 21. (3 pts.) Using your infrared spectrum of the starting alcohol, complete the table below for all peaks with frequencies greater than 1500 cm) that can be assigned to vibrations of specific bonds. For each peak give the frequency, the specific bond that vibration frequency...
help! 18. (2 pts.) The equations for organic reactions usually focus on the desired transformation from...
 help!
18. (2 pts.) The equations for organic reactions usually focus on the desired transformation from reactant to product, other possible products such as byproducts and/or side products are often not included, even though it is understood that these are also formed in almost every organic reaction. Shown below is a complete equation for the ester synthesis reaction for the case of 2-pentanol, that includes all possible products, including the desired product, side product(s) and in this case some byproducts...
help!
18. (2 pts.) The equations for organic reactions usually focus on the desired transformation from reactant to product, other possible products such as byproducts and/or side products are often not included, even though it is understood that these are also formed in almost every organic reaction. Shown below is a complete equation for the ester synthesis reaction for the case of 2-pentanol, that includes all possible products, including the desired product, side product(s) and in this case some byproducts...
Tools Window Help OMX 75% Esterification Experiment Lab Data.pdf (page 1 of 3) Search Product Ester...
 Tools Window Help OMX 75% Esterification Experiment Lab Data.pdf (page 1 of 3) Search Product Ester IR of starting alcohol (1-pentanol) 1-Pentanol M. AM 19ra aromo 14, 2017 m. 1% 1075 20 . 2030 26.1.60.39 10 4000 3500 . 1000 3000 INT 650 2500 cm-1 2000 1500 M 8 Tools Window Help 78 Wed 2:19 PM Go Esterification Experiment Lab Data pdf page 2 of 3) @ Q Search IR of final product (ester) Product Ester Guided Instructions for In-Lab...
IR Worksheet 1. For each spectrum below: 1) Label the major peaks with their approximate frequency....
 IR Worksheet 1. For each spectrum below: 1) Label the major peaks with their approximate frequency. 2) Identify the bond vibration and possible functional group associated with each peak. 3) Match the spectra to one of these possible compounds: NH2 TRANSMITTANCE[%] pobo edo "2060 bo zdoo 160 Tobo 560 WAVENUMBER [cm-1] oot 08 TRANSMITTANCE [%] 09 01 02 4000 3500 3000 2500 2000 WAVENUMBER (cm-1] 1500 1000 500 οοο TRANSMITTANCE (6) οο οο οε 4000 3500 3000 1500 1000 2500...
23. (3 pts.) Assign the peaks in the infrared spectrum of triphenylmethanol with frequencies greater than...
 23. (3 pts.) Assign the peaks in the infrared spectrum of triphenylmethanol with frequencies greater than 1500 cm1 to specific bond vibrations AND the functional group the bond is associated with. Clearly indicate the specific bond vibration that is associated with the relevant peaks. 12 LOD 3026 1598 3062 130300 890 SD OH 1157 1450 3464 1010 1445 757 4000 2000 1500 1000 500
IR spectrum for Co(Salen) IR spectrum for Salen H2 80 110 100 1% 120 -06 3500...
 IR spectrum for Co(Salen)
IR spectrum for Salen H2
80 110 100 1% 120 -06 3500 FTIR Measurement 3000 3051.39 3020.53 2929.87 2500 2000 1750 1625.99 1606.70 1543.05. 7.62 1469.76 1500 1250 1409.25 1348.24 1330.881 1290.38 1205.511 1197.79 1139.931 1126.43 1087.85 1053.13 954.76 904.61 852.54 759.95 1000 std-0131 750.317 744.52 cm-1 750 732.95 Fill up the table below Wavenumber Intensity (cm) (vs/s/m/w/br) Assigned vibration Assigned functional group Template 1 for Co(Salen) std-0130 95 %T 90 85 80+ 75 2899.01 1371.39...
IR spectrum for Co(Salen)
IR spectrum for Salen H2
80 110 100 1% 120 -06 3500 FTIR Measurement 3000 3051.39 3020.53 2929.87 2500 2000 1750 1625.99 1606.70 1543.05. 7.62 1469.76 1500 1250 1409.25 1348.24 1330.881 1290.38 1205.511 1197.79 1139.931 1126.43 1087.85 1053.13 954.76 904.61 852.54 759.95 1000 std-0131 750.317 744.52 cm-1 750 732.95 Fill up the table below Wavenumber Intensity (cm) (vs/s/m/w/br) Assigned vibration Assigned functional group Template 1 for Co(Salen) std-0130 95 %T 90 85 80+ 75 2899.01 1371.39...
Label all peaks of this IR spectrum. Please help me. 3500 3000 2961.48 2869.66 2500 Wavenumbers...
 Label all peaks of this IR spectrum. Please help
me.
3500 3000 2961.48 2869.66 2500 Wavenumbers (cm-1) 2000 1745.65 1500 1387.86 1368.87 1229.55 1000 500 Infrared Peak (cm) Structural Assignment
Label all peaks of this IR spectrum. Please help
me.
3500 3000 2961.48 2869.66 2500 Wavenumbers (cm-1) 2000 1745.65 1500 1387.86 1368.87 1229.55 1000 500 Infrared Peak (cm) Structural Assignment
Use the following correlation chart to help answer the IR spectrum questions: small range range of...
 Use the following correlation chart to help answer the IR spectrum questions: small range range of values N-H -O-H-CEN usually broad peak C-o strong 1600-1660 EC-H 3250-3300 2200 1680 gco sco 2710- 2820 2 peaks 3000- 3100 CECH (N-H C-H 1730 2200 broad with spikes --3300 O-H 1600 2850- 2960 1710 broad-3300-3400 -CO-H broad-3000 1650 4000 3500 3000 2000 1500 2500 wavenumber, cm 1000 1. (2 pts.) Shown below are IR spectra of cyclohexanecarbaldehyde (I) and cyclohexene (II). Which of...
1. shown below are IR spectra of cyclohexanecarbaldehyde (I) and cyclohexene (II). which of the spectra...
 1. shown below are IR spectra of cyclohexanecarbaldehyde (I)
and cyclohexene (II). which of the spectra A and B corresponds to
which structure (I or II)? On each spectrum identify the peaks that
are associated with a specific bond vibration bond by drawing the
functional group for that bond, circling the specific vibrating
bond and drying and arrow from the circled bond to the absorption
peak. include all the C-H bonds.
2. provided below are IR spectra of
1,2,3,6-tetrahydrobenzaldehyde (I)...
1. shown below are IR spectra of cyclohexanecarbaldehyde (I)
and cyclohexene (II). which of the spectra A and B corresponds to
which structure (I or II)? On each spectrum identify the peaks that
are associated with a specific bond vibration bond by drawing the
functional group for that bond, circling the specific vibrating
bond and drying and arrow from the circled bond to the absorption
peak. include all the C-H bonds.
2. provided below are IR spectra of
1,2,3,6-tetrahydrobenzaldehyde (I)...
Which peaks in your IR spectrum match the known structure of caffeine? for each diagnostic peak,...
 Which peaks in your IR spectrum match the known structure of
caffeine? for each diagnostic peak, you should identify its
frequency in wavenumbers and the probable vibration (e.q 2950 cm,
alkane C-H stretch). You should then write a short discussion that
matches the diagnostic peaks to a functional group in caffeine
structure
Label all the function groups
P lanta лече Јr- 1 0.95 UCSB ^3i16.01 rasang 0.90 0.85 * - ๒ ๆ ในWS หาน AA 1) hMtAM Y Units 4...
Which peaks in your IR spectrum match the known structure of
caffeine? for each diagnostic peak, you should identify its
frequency in wavenumbers and the probable vibration (e.q 2950 cm,
alkane C-H stretch). You should then write a short discussion that
matches the diagnostic peaks to a functional group in caffeine
structure
Label all the function groups
P lanta лече Јr- 1 0.95 UCSB ^3i16.01 rasang 0.90 0.85 * - ๒ ๆ ในWS หาน AA 1) hMtAM Y Units 4...
 1-Pentanol Ndoo 380m .95.3144 1114.834m 19017 1378.31cm-1. ppcm-1,6 3319.13cm.1, 85 67%T %T 1463 27cm-1.06.20%T 17 728.700m-1.16 21% 1075.28671.81 65%T 2863.37cm-1, 77.98%T 1005cm-1.78.20%T 2956 260m-1.77.52 29:30.260m-1.00.35% 1053.7 m 1,606157 1000650 3500 3000 2000 1500 2500 cm-1 21. (3 pts.) Using your infrared spectrum of the starting alcohol, complete the table below for all peaks with frequencies greater than 1500 cm) that can be assigned to vibrations of specific bonds. For each peak give the frequency, the specific bond that vibration frequency...
 help!
18. (2 pts.) The equations for organic reactions usually focus on the desired transformation from reactant to product, other possible products such as byproducts and/or side products are often not included, even though it is understood that these are also formed in almost every organic reaction. Shown below is a complete equation for the ester synthesis reaction for the case of 2-pentanol, that includes all possible products, including the desired product, side product(s) and in this case some byproducts...
help!
18. (2 pts.) The equations for organic reactions usually focus on the desired transformation from reactant to product, other possible products such as byproducts and/or side products are often not included, even though it is understood that these are also formed in almost every organic reaction. Shown below is a complete equation for the ester synthesis reaction for the case of 2-pentanol, that includes all possible products, including the desired product, side product(s) and in this case some byproducts...
 Tools Window Help OMX 75% Esterification Experiment Lab Data.pdf (page 1 of 3) Search Product Ester IR of starting alcohol (1-pentanol) 1-Pentanol M. AM 19ra aromo 14, 2017 m. 1% 1075 20 . 2030 26.1.60.39 10 4000 3500 . 1000 3000 INT 650 2500 cm-1 2000 1500 M 8 Tools Window Help 78 Wed 2:19 PM Go Esterification Experiment Lab Data pdf page 2 of 3) @ Q Search IR of final product (ester) Product Ester Guided Instructions for In-Lab...
 IR Worksheet 1. For each spectrum below: 1) Label the major peaks with their approximate frequency. 2) Identify the bond vibration and possible functional group associated with each peak. 3) Match the spectra to one of these possible compounds: NH2 TRANSMITTANCE[%] pobo edo "2060 bo zdoo 160 Tobo 560 WAVENUMBER [cm-1] oot 08 TRANSMITTANCE [%] 09 01 02 4000 3500 3000 2500 2000 WAVENUMBER (cm-1] 1500 1000 500 οοο TRANSMITTANCE (6) οο οο οε 4000 3500 3000 1500 1000 2500...
 23. (3 pts.) Assign the peaks in the infrared spectrum of triphenylmethanol with frequencies greater than 1500 cm1 to specific bond vibrations AND the functional group the bond is associated with. Clearly indicate the specific bond vibration that is associated with the relevant peaks. 12 LOD 3026 1598 3062 130300 890 SD OH 1157 1450 3464 1010 1445 757 4000 2000 1500 1000 500
 IR spectrum for Co(Salen)
IR spectrum for Salen H2
80 110 100 1% 120 -06 3500 FTIR Measurement 3000 3051.39 3020.53 2929.87 2500 2000 1750 1625.99 1606.70 1543.05. 7.62 1469.76 1500 1250 1409.25 1348.24 1330.881 1290.38 1205.511 1197.79 1139.931 1126.43 1087.85 1053.13 954.76 904.61 852.54 759.95 1000 std-0131 750.317 744.52 cm-1 750 732.95 Fill up the table below Wavenumber Intensity (cm) (vs/s/m/w/br) Assigned vibration Assigned functional group Template 1 for Co(Salen) std-0130 95 %T 90 85 80+ 75 2899.01 1371.39...
IR spectrum for Co(Salen)
IR spectrum for Salen H2
80 110 100 1% 120 -06 3500 FTIR Measurement 3000 3051.39 3020.53 2929.87 2500 2000 1750 1625.99 1606.70 1543.05. 7.62 1469.76 1500 1250 1409.25 1348.24 1330.881 1290.38 1205.511 1197.79 1139.931 1126.43 1087.85 1053.13 954.76 904.61 852.54 759.95 1000 std-0131 750.317 744.52 cm-1 750 732.95 Fill up the table below Wavenumber Intensity (cm) (vs/s/m/w/br) Assigned vibration Assigned functional group Template 1 for Co(Salen) std-0130 95 %T 90 85 80+ 75 2899.01 1371.39...
 Label all peaks of this IR spectrum. Please help
me.
3500 3000 2961.48 2869.66 2500 Wavenumbers (cm-1) 2000 1745.65 1500 1387.86 1368.87 1229.55 1000 500 Infrared Peak (cm) Structural Assignment
Label all peaks of this IR spectrum. Please help
me.
3500 3000 2961.48 2869.66 2500 Wavenumbers (cm-1) 2000 1745.65 1500 1387.86 1368.87 1229.55 1000 500 Infrared Peak (cm) Structural Assignment
 Use the following correlation chart to help answer the IR spectrum questions: small range range of values N-H -O-H-CEN usually broad peak C-o strong 1600-1660 EC-H 3250-3300 2200 1680 gco sco 2710- 2820 2 peaks 3000- 3100 CECH (N-H C-H 1730 2200 broad with spikes --3300 O-H 1600 2850- 2960 1710 broad-3300-3400 -CO-H broad-3000 1650 4000 3500 3000 2000 1500 2500 wavenumber, cm 1000 1. (2 pts.) Shown below are IR spectra of cyclohexanecarbaldehyde (I) and cyclohexene (II). Which of...
 1. shown below are IR spectra of cyclohexanecarbaldehyde (I)
and cyclohexene (II). which of the spectra A and B corresponds to
which structure (I or II)? On each spectrum identify the peaks that
are associated with a specific bond vibration bond by drawing the
functional group for that bond, circling the specific vibrating
bond and drying and arrow from the circled bond to the absorption
peak. include all the C-H bonds.
2. provided below are IR spectra of
1,2,3,6-tetrahydrobenzaldehyde (I)...
1. shown below are IR spectra of cyclohexanecarbaldehyde (I)
and cyclohexene (II). which of the spectra A and B corresponds to
which structure (I or II)? On each spectrum identify the peaks that
are associated with a specific bond vibration bond by drawing the
functional group for that bond, circling the specific vibrating
bond and drying and arrow from the circled bond to the absorption
peak. include all the C-H bonds.
2. provided below are IR spectra of
1,2,3,6-tetrahydrobenzaldehyde (I)...
 Which peaks in your IR spectrum match the known structure of
caffeine? for each diagnostic peak, you should identify its
frequency in wavenumbers and the probable vibration (e.q 2950 cm,
alkane C-H stretch). You should then write a short discussion that
matches the diagnostic peaks to a functional group in caffeine
structure
Label all the function groups
P lanta лече Јr- 1 0.95 UCSB ^3i16.01 rasang 0.90 0.85 * - ๒ ๆ ในWS หาน AA 1) hMtAM Y Units 4...
Which peaks in your IR spectrum match the known structure of
caffeine? for each diagnostic peak, you should identify its
frequency in wavenumbers and the probable vibration (e.q 2950 cm,
alkane C-H stretch). You should then write a short discussion that
matches the diagnostic peaks to a functional group in caffeine
structure
Label all the function groups
P lanta лече Јr- 1 0.95 UCSB ^3i16.01 rasang 0.90 0.85 * - ๒ ๆ ในWS หาน AA 1) hMtAM Y Units 4...
Most questions answered within 3 hours.
-
If a block of Si is doped with 10^17 Boron atom/cm^3 and 5X10^16
Arsenic atoms/cm^3,
(a)...
asked 4 minutes ago -
Why would natural selection not minimize costs (in the form of
symptoms) of evolved defenses? (choose...
asked 22 minutes ago -
What is true about a critical task?
Latest finish time - latest start time = 0...
asked 24 minutes ago -
A company uses a
process costing system. Its Assembly Department's beginning
inventory consisted of 56,800 units,...
asked 24 minutes ago -
a
sealed glass cylinder contains 325 g of N2 gas at 1.02 atm at 20 c....
asked 28 minutes ago -
The main difference between an equity and a nonequity alliance
is that
A
equity alliances are...
asked 27 minutes ago -
Need help with this, in JAVA, using netbeans. A
complete response will receive a positive comment...
asked 35 minutes ago -
An imprest petty cash fund of $600 was established for minor
disbursements. At the end of...
asked 40 minutes ago -
Sharpe Cutter is a small company that produces specialty knives
for paper cutting machinery. The annual...
asked 44 minutes ago -
Calculating the Ka of a weak acid from
pH:
The pH of a 0.68M solution of...
asked 46 minutes ago -
1.What process is pushing back against gravity in the very
center (the core) of sun-like stars?...
asked 1 hour ago -
This question is from the textbook "Python for ArcGIS" by Laura
Tateosian:
Write a script "triangles.py"...
asked 1 hour ago