Creating Balance Sheets and Income
Statements
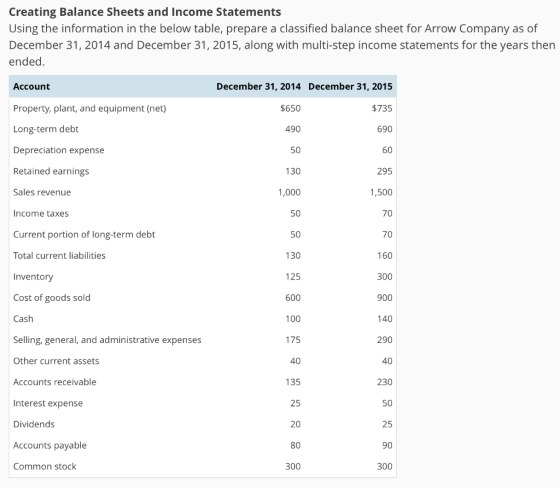
Using the information in the below table, prepare a classified
balance sheet for Arrow Company as of December 31, 2014 and
December 31, 2015, along with multi-step income statements for the
years then ended.
| Account | December 31, 2014 | December 31, 2015 | |
|---|---|---|---|
| Property, plant, and equipment (net) | $650 | $735 | |
| Long-term debt | 490 | 690 | |
| Depreciation expense | 50 | 60 | |
| Retained earnings | 130 | 295 | |
| Sales revenue | 1,000 | 1,500 | |
| Income taxes | 50 | 70 | |
| Current portion of long-term debt | 50 | 70 | |
| Total current liabilities | 130 | 160 | |
| Inventory | 125 | 300 | |
| Cost of goods sold | 600 | 900 | |
| Cash | 100 | 140 | |
| Selling, general, and administrative expenses | 175 | 290 | |
| Other current assets | 40 | 40 | |
| Accounts receivable | 135 | 230 | |
| Interest expense | 25 | 50 | |
| Dividends | 20 | 25 | |
| Accounts payable | 80 | 90 | |
| Common stock | 300 | 300 |
| Arrow Company | |||
|---|---|---|---|
| Balance Sheet | |||
| As of December 31, 2015 | |||
| 2015 | 2014 | ||
| Cash | $ | $ | |
| Accounts Receivable | |||
| Common stockCurrent portion of long-term debtDepreciation expenseDividendsIncome taxesInterest expenseInventoryLong-term debtNet incomeOperating incomeProperty, plant and equipmentSales | |||
| Other current assets | |||
| Total current assets | |||
| Common stockCurrent portion of long-term debtDepreciation expenseDividendsIncome taxesInterest expenseInventoryLong-term debtNet incomeOperating incomeProperty, plant and equipmentSales | |||
| Total assets | $ | $ | |
| Accounts payable | $ | $ | |
| Common stockCurrent portion of long-term debtDepreciation expenseDividendsIncome taxesInterest expenseInventoryLong-term debtNet incomeOperating incomeProperty, plant and equipmentSales | |||
| Total current liabilities | |||
| Common stockCurrent portion of long-term debtDepreciation expenseDividendsIncome taxesInterest expenseInventoryLong-term debtNet incomeOperating incomeProperty, plant and equipmentSales | |||
| Total liabilities | |||
| Common stockCurrent portion of long-term debtDepreciation expenseDividendsIncome taxesInterest expenseInventoryLong-term debtNet incomeOperating incomeProperty, plant and equipmentSales | |||
| Retained earnings | |||
| Total equity | |||
| Total liabilities and equity | $ | $ | |
| Arrow Company | |||
|---|---|---|---|
| Income Statement | |||
| For the year ended December 31, 2015 | |||
| 2015 | 2014 | ||
| Common stockCurrent portion of long-term debtDepreciation expenseDividendsIncome taxesInterest expenseInventoryLong-term debtNet incomeOperating incomeProperty, plant and equipmentSales | $ | $ | |
| Cost of goods sold | |||
| Gross profit | |||
| Selling, general, & administrative expenses | |||
| Common stockCurrent portion of long-term debtDepreciation expenseDividendsIncome taxesInterest expenseInventoryLong-term debtNet incomeOperating incomeProperty, plant and equipmentSales | |||
| Common stockCurrent portion of long-term debtDepreciation expenseDividendsIncome taxesInterest expenseInventoryLong-term debtNet incomeOperating incomeProperty, plant and equipmentSales | |||
| Common stockCurrent portion of long-term debtDepreciation expenseDividendsIncome taxesInterest expenseInventoryLong-term debtNet incomeOperating incomeProperty, plant and equipmentSales | |||
| Pretax income | |||
| Common stockCurrent portion of long-term debtDepreciation expenseDividendsIncome taxesInterest expenseInventoryLong-term debtNet incomeOperating incomeProperty, plant and equipmentSales | |||
| Common stockCurrent portion of long-term debtDepreciation expenseDividendsIncome taxesInterest expenseInventoryLong-term debtNet incomeOperating incomeProperty, plant and equipmentSales | |||

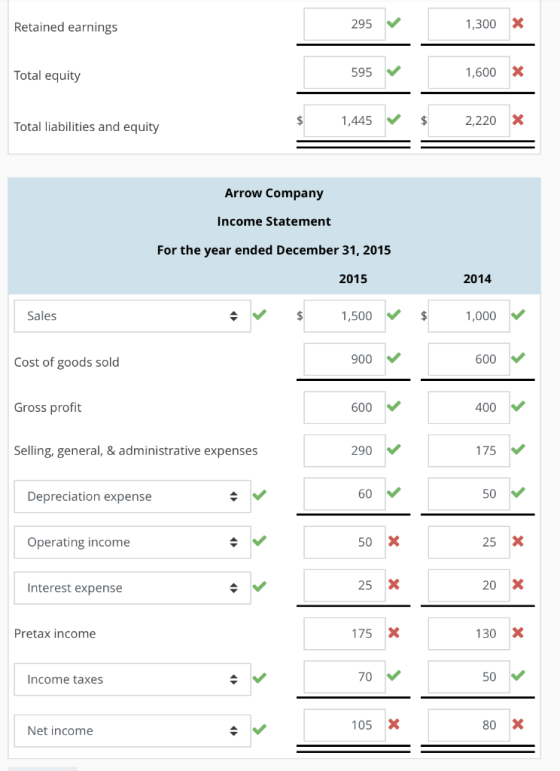
Balance Sheet As of December 31, 2015 2015 2014 140 100 Cash Accounts Receivable 230 135 300 125 Inventory 40 40 Other current assets Total current assets 400 710 735 650 Property, plant and equipment 1,445 $ 1,050 Total assets Accounts payable 90 80 70 50 Current portion of long-term debt Total current liabilities 160 130 690 490 Long-term debt Total liabilities 850 620 Common stock 300 300 X 295 1,300 Retained earnings
295 1,300 Retained earnings X Total equity 595 1,600 X $ 2,220 1,445 Total liabilities and equity Arrow Company Income Statement For the year ended December 31, 2015 2015 2014 Sales $ 1,500 1,000 900 600 Cost of goods sold Gross profit 600 400 Selling, general, & administrative expenses 290 175 50 60 Depreciation expense Operating income 50 25 X 25 20 Interest expense X Pretax income 175 130 50 70 Income taxes 80 105 Net income
Homework Answers
Answer:
| Balance Sheet | ||
| 2015 | 2014 | |
| Cash | $ 140 | $ 100 |
| Accounts receivable | $ 230 | $ 135 |
| Inventoy | $ 300 | $ 125 |
| Other current assets | $ 40 | $ 40 |
| Total current assets | $ 710 | $ 400 |
| Property, plant and equipment | $ 735 | $ 650 |
| Total assets | $ 1,445 | $ 1,050 |
| Accounts payable | $ 90 | $ 80 |
| Current portion of long term debt | $ 70 | $ 50 |
| Total current liabilities | $ 160 | $ 130 |
| Long term debt | $ 690 | $ 490 |
| Total liabilities | $ 850 | $ 620 |
| Common stock | $ 300 | $ 300 |
| Retained earnings | $ 295 | $ 130 |
| Retained earnings | $ 295 | $ 130 |
| Total equity | $ 595 | $ 430 |
| Total liabilities and equity | $ 1,445 | $ 1,050 |
| Income Statement | ||
| 2015 | 2014 | |
| Sales | $ 1,500 | $ 1,000 |
| Cost of goods sold | $ 900 | $ 600 |
| Gross profit | $ 600 | $ 400 |
| Sales, general & administration overheads | $ 290 | $ 175 |
| Depreciation expense | $ 60 | $ 50 |
| Operating income | $ 250 | $ 175 |
| Interest expense | $ 50 | $ 25 |
| Pretax income | $ 200 | $ 150 |
| Income taxes | $ 70 | $ 50 |
| Net income | $ 130 | $ 100 |
In case of any doubt, please comment.
Add Answer to:
Creating Balance Sheets and Income Statements Using the information in the below table, prepare a classified...
Common-Size Balance Sheets Following is the balance sheet for Target Corporation. Prepare Target's common-size balance sheets...
 Common-Size Balance Sheets Following is the balance sheet for Target Corporation. Prepare Target's common-size balance sheets as of January 31, 2015 and February 1, 2014 (Round your answers to one decimal place.) January 31, February 1, (5 millions) 2015 2014 Assets Cash and cash equivalents 52.210 5670 Inventory 8.790 Other current assets 2.625 Total current assets 14,087 11,573 Property and equipment, net 25,958 26,412 Other noncurrent assets 1,359 6,568 Total assets $41,404 $44,553 Liabilities and shareholders' investment Accounts payable 57,759...
Question 3 Table 12-5 The following are the income statements and balance sheets for Amazon Pools...
Question 3 Table 12-5 The following are the income statements and balance sheets for Amazon Pools and Spas at and for the years ended December 31, 2X10, 2X09, and 2X08: Amazon Pools and Spas Combined Statements of Income For the Years Ended December 31, 2X10, 2X09, and 2X08 2X10 2X09 2X08 Sales (all credit sales) $800 $740 $675 Less Cost of Goods Sold 525 490 450 Gross Profit $275 $250 $225 Less Operating Expenses 150 140 125 Operating Income $125...
Using the income statement and balance sheets of Niagara Company below, prepare a statement of cash flows for the year e...
 Using the income statement and balance sheets of Niagara Company
below, prepare a statement of cash flows for the year ended
December 31, Year 9, using the direct method.
NIAGRARA COMPANY
Income statement For Year Ended Dec.31,
Year9
Sales
$1000
Cost of goods sold
(650)
Depreciation expense
(100)
Sales and general expense
(100)
Interest expense
(50)
Income tax expense
(40)
Net income
$60
NIAGARA COMPANY Balance Sheets December 31, Year 9 and Year 8 Year 8 Year 9 $ 60...
Using the income statement and balance sheets of Niagara Company
below, prepare a statement of cash flows for the year ended
December 31, Year 9, using the direct method.
NIAGRARA COMPANY
Income statement For Year Ended Dec.31,
Year9
Sales
$1000
Cost of goods sold
(650)
Depreciation expense
(100)
Sales and general expense
(100)
Interest expense
(50)
Income tax expense
(40)
Net income
$60
NIAGARA COMPANY Balance Sheets December 31, Year 9 and Year 8 Year 8 Year 9 $ 60...
Common-Size Balance Sheets Following is the balance sheet for 3M Company. Prepare common-size balance sheets for...
 Common-Size Balance Sheets Following is the balance sheet for 3M Company. Prepare common-size balance sheets for 2014 and 2013 Round answers to one decimal place. (i.e., 0.8867 88.7%) 3M Company and Subsidiaries Common-size Balance Sheets Dec. 31, 2014 Dec. 31, 2013 (s millions) Cash and cash equivalents Accounts receivable Total inventories 01% $3.337 ,253 3,864 0 9% 1,279 0% 12,733 1,575 8,652 ,345 1,688 $2,523 4,238 3,706 0% 0% Other current assets 1,298 11,765 930 8,489 7,050 Total current assets...
Complete the table below for the liabilities and owners' equity part of the balance sheet Barron...
 Complete the table below for the liabilities and owners' equity
part of the balance sheet
Barron Pizza, Inc. Balance Sheet as of December 31, 2012, 2013, and 2014 (S in thousands) LIABILITIES 2014 2013 2012 Current liabilities Accounts payable s $ 74.480 $ 66,107 Short-term debt $ 271 $ $ 300 Total current liabilities $ 80,948 $ 74,712 $ Long-term debt $ 60,984 $C $ 184,975 Other liabilities $ 28,817 $ 20,182 Total liabilities $ 187,832 $ 243,549 $ OWNERS'...
Complete the table below for the liabilities and owners' equity
part of the balance sheet
Barron Pizza, Inc. Balance Sheet as of December 31, 2012, 2013, and 2014 (S in thousands) LIABILITIES 2014 2013 2012 Current liabilities Accounts payable s $ 74.480 $ 66,107 Short-term debt $ 271 $ $ 300 Total current liabilities $ 80,948 $ 74,712 $ Long-term debt $ 60,984 $C $ 184,975 Other liabilities $ 28,817 $ 20,182 Total liabilities $ 187,832 $ 243,549 $ OWNERS'...
Analysis and Interpretation of Profitability Balance sheets and income statements for 3M Company follow. 3M COMPANY...
Analysis and Interpretation of Profitability Balance sheets and income statements for 3M Company follow. 3M COMPANY Consolidated Statements of Income For Years ended December 31 ($ millions) 2015 2014 2013 Net sales $30,274 $31,821 $30,871 Operating expenses Cost of sales 15,383 16,447 16,106 Selling, general and administrative expenses 6,182 6,469 6,384 Research, development and related expenses 1,763 1,770 1,715 Total operating expenses 23,328 24,686 24,205 Operating income 6,946 7,135 6,666 Interest expenses and income Interest expense 149 142 145 Interest...
Just Dew It Corporation reports the following balance sheet information for 2014 and 2015. Prepare the...
 Just Dew It Corporation reports the following balance sheet
information for 2014 and 2015.
Prepare the 2015 combined common-size, common–base year balance
sheet for Just Dew It. (Do not round intermediate
calculations. Round your answers to 4 decimal places, e.g.,
32.1616.)
Any help is appreciated :)
JUST DEW IT CORPORATION 2014 and 2015 Balance Sheets Assets Liabilities and Owners' Equity 2014 2015 2014 2015 Current assets Current liabilities Cash Accounts receivable Inventory $ 6,560 16,160 61,280 $ 8,600 22,600 74,600...
Just Dew It Corporation reports the following balance sheet
information for 2014 and 2015.
Prepare the 2015 combined common-size, common–base year balance
sheet for Just Dew It. (Do not round intermediate
calculations. Round your answers to 4 decimal places, e.g.,
32.1616.)
Any help is appreciated :)
JUST DEW IT CORPORATION 2014 and 2015 Balance Sheets Assets Liabilities and Owners' Equity 2014 2015 2014 2015 Current assets Current liabilities Cash Accounts receivable Inventory $ 6,560 16,160 61,280 $ 8,600 22,600 74,600...
PLease answer A-D P4-41. Analysis and Interpretation of Profitability Balance sheets and income statements for 3M...
 PLease answer A-D
P4-41. Analysis and Interpretation of Profitability Balance sheets and income statements for 3M Company follow. 3M COMPANY Consolidated Statements of Income For Years Ended Dec. 31 ($ millions) 2015 2013 2014 $31,821 $30,274 $30,871 15,383 6,182 1,763 16,447 6,469 1,770 24,686 7135 16,106 6,384 1,715 24,205 6,666 23,328 6,946 Net sales ............................................ Operating expenses Cost of sales. Selling, general and administrative expenses ......... Research, development and related expenses ........ Total operating expenses....... Operating income..... Interest expense and...
PLease answer A-D
P4-41. Analysis and Interpretation of Profitability Balance sheets and income statements for 3M Company follow. 3M COMPANY Consolidated Statements of Income For Years Ended Dec. 31 ($ millions) 2015 2013 2014 $31,821 $30,274 $30,871 15,383 6,182 1,763 16,447 6,469 1,770 24,686 7135 16,106 6,384 1,715 24,205 6,666 23,328 6,946 Net sales ............................................ Operating expenses Cost of sales. Selling, general and administrative expenses ......... Research, development and related expenses ........ Total operating expenses....... Operating income..... Interest expense and...
Required Use the following information to prepare a classified balance sheet for Alpha Co. at the...
 Required Use the following information to prepare a classified balance sheet for Alpha Co. at the end of 2018. Accounts receivable $44,980 9,815 13,320 40,500 17,000 22,800 28,075 30, 260 Accounts payable Cash Common stock Land Long-term notes payable Merchandise inventory Retained earnings ALPHA CO. Classified Balance Sheet As of December 31, 2018 Assets ALPHA CO. Classified Balance Sheet As of December 31, 2018 Assets Current assets Total current assets Property, plant and equipment Total property, plant and equipment Total...
Prepare common-sized balance sheet and income statements for the company for 2017 and 2018. All values...
 Prepare common-sized balance sheet and income statements for the
company for 2017 and 2018. All values in millions except for per
share data. (In $, not %)
12/31/18 12/31/17 Sales Cost Of Goods Gross Profit Selling & Adminstrative & Depr. & Amort Expenses Income After Depreciation & Amortization Non-Operating Income Interest Expense Pretax Income -11 -21 -20 Income Taxes Minority Interest Investment Gains/Losses Other Income/Charges 0 0 00 -9 -20 - 0 22 Income From Cont. Operations Extras & Discontinued...
Prepare common-sized balance sheet and income statements for the
company for 2017 and 2018. All values in millions except for per
share data. (In $, not %)
12/31/18 12/31/17 Sales Cost Of Goods Gross Profit Selling & Adminstrative & Depr. & Amort Expenses Income After Depreciation & Amortization Non-Operating Income Interest Expense Pretax Income -11 -21 -20 Income Taxes Minority Interest Investment Gains/Losses Other Income/Charges 0 0 00 -9 -20 - 0 22 Income From Cont. Operations Extras & Discontinued...
 Common-Size Balance Sheets Following is the balance sheet for Target Corporation. Prepare Target's common-size balance sheets as of January 31, 2015 and February 1, 2014 (Round your answers to one decimal place.) January 31, February 1, (5 millions) 2015 2014 Assets Cash and cash equivalents 52.210 5670 Inventory 8.790 Other current assets 2.625 Total current assets 14,087 11,573 Property and equipment, net 25,958 26,412 Other noncurrent assets 1,359 6,568 Total assets $41,404 $44,553 Liabilities and shareholders' investment Accounts payable 57,759...
 Using the income statement and balance sheets of Niagara Company
below, prepare a statement of cash flows for the year ended
December 31, Year 9, using the direct method.
NIAGRARA COMPANY
Income statement For Year Ended Dec.31,
Year9
Sales
$1000
Cost of goods sold
(650)
Depreciation expense
(100)
Sales and general expense
(100)
Interest expense
(50)
Income tax expense
(40)
Net income
$60
NIAGARA COMPANY Balance Sheets December 31, Year 9 and Year 8 Year 8 Year 9 $ 60...
Using the income statement and balance sheets of Niagara Company
below, prepare a statement of cash flows for the year ended
December 31, Year 9, using the direct method.
NIAGRARA COMPANY
Income statement For Year Ended Dec.31,
Year9
Sales
$1000
Cost of goods sold
(650)
Depreciation expense
(100)
Sales and general expense
(100)
Interest expense
(50)
Income tax expense
(40)
Net income
$60
NIAGARA COMPANY Balance Sheets December 31, Year 9 and Year 8 Year 8 Year 9 $ 60...
 Common-Size Balance Sheets Following is the balance sheet for 3M Company. Prepare common-size balance sheets for 2014 and 2013 Round answers to one decimal place. (i.e., 0.8867 88.7%) 3M Company and Subsidiaries Common-size Balance Sheets Dec. 31, 2014 Dec. 31, 2013 (s millions) Cash and cash equivalents Accounts receivable Total inventories 01% $3.337 ,253 3,864 0 9% 1,279 0% 12,733 1,575 8,652 ,345 1,688 $2,523 4,238 3,706 0% 0% Other current assets 1,298 11,765 930 8,489 7,050 Total current assets...
 Complete the table below for the liabilities and owners' equity
part of the balance sheet
Barron Pizza, Inc. Balance Sheet as of December 31, 2012, 2013, and 2014 (S in thousands) LIABILITIES 2014 2013 2012 Current liabilities Accounts payable s $ 74.480 $ 66,107 Short-term debt $ 271 $ $ 300 Total current liabilities $ 80,948 $ 74,712 $ Long-term debt $ 60,984 $C $ 184,975 Other liabilities $ 28,817 $ 20,182 Total liabilities $ 187,832 $ 243,549 $ OWNERS'...
Complete the table below for the liabilities and owners' equity
part of the balance sheet
Barron Pizza, Inc. Balance Sheet as of December 31, 2012, 2013, and 2014 (S in thousands) LIABILITIES 2014 2013 2012 Current liabilities Accounts payable s $ 74.480 $ 66,107 Short-term debt $ 271 $ $ 300 Total current liabilities $ 80,948 $ 74,712 $ Long-term debt $ 60,984 $C $ 184,975 Other liabilities $ 28,817 $ 20,182 Total liabilities $ 187,832 $ 243,549 $ OWNERS'...
 Just Dew It Corporation reports the following balance sheet
information for 2014 and 2015.
Prepare the 2015 combined common-size, common–base year balance
sheet for Just Dew It. (Do not round intermediate
calculations. Round your answers to 4 decimal places, e.g.,
32.1616.)
Any help is appreciated :)
JUST DEW IT CORPORATION 2014 and 2015 Balance Sheets Assets Liabilities and Owners' Equity 2014 2015 2014 2015 Current assets Current liabilities Cash Accounts receivable Inventory $ 6,560 16,160 61,280 $ 8,600 22,600 74,600...
Just Dew It Corporation reports the following balance sheet
information for 2014 and 2015.
Prepare the 2015 combined common-size, common–base year balance
sheet for Just Dew It. (Do not round intermediate
calculations. Round your answers to 4 decimal places, e.g.,
32.1616.)
Any help is appreciated :)
JUST DEW IT CORPORATION 2014 and 2015 Balance Sheets Assets Liabilities and Owners' Equity 2014 2015 2014 2015 Current assets Current liabilities Cash Accounts receivable Inventory $ 6,560 16,160 61,280 $ 8,600 22,600 74,600...
 PLease answer A-D
P4-41. Analysis and Interpretation of Profitability Balance sheets and income statements for 3M Company follow. 3M COMPANY Consolidated Statements of Income For Years Ended Dec. 31 ($ millions) 2015 2013 2014 $31,821 $30,274 $30,871 15,383 6,182 1,763 16,447 6,469 1,770 24,686 7135 16,106 6,384 1,715 24,205 6,666 23,328 6,946 Net sales ............................................ Operating expenses Cost of sales. Selling, general and administrative expenses ......... Research, development and related expenses ........ Total operating expenses....... Operating income..... Interest expense and...
PLease answer A-D
P4-41. Analysis and Interpretation of Profitability Balance sheets and income statements for 3M Company follow. 3M COMPANY Consolidated Statements of Income For Years Ended Dec. 31 ($ millions) 2015 2013 2014 $31,821 $30,274 $30,871 15,383 6,182 1,763 16,447 6,469 1,770 24,686 7135 16,106 6,384 1,715 24,205 6,666 23,328 6,946 Net sales ............................................ Operating expenses Cost of sales. Selling, general and administrative expenses ......... Research, development and related expenses ........ Total operating expenses....... Operating income..... Interest expense and...
 Required Use the following information to prepare a classified balance sheet for Alpha Co. at the end of 2018. Accounts receivable $44,980 9,815 13,320 40,500 17,000 22,800 28,075 30, 260 Accounts payable Cash Common stock Land Long-term notes payable Merchandise inventory Retained earnings ALPHA CO. Classified Balance Sheet As of December 31, 2018 Assets ALPHA CO. Classified Balance Sheet As of December 31, 2018 Assets Current assets Total current assets Property, plant and equipment Total property, plant and equipment Total...
 Prepare common-sized balance sheet and income statements for the
company for 2017 and 2018. All values in millions except for per
share data. (In $, not %)
12/31/18 12/31/17 Sales Cost Of Goods Gross Profit Selling & Adminstrative & Depr. & Amort Expenses Income After Depreciation & Amortization Non-Operating Income Interest Expense Pretax Income -11 -21 -20 Income Taxes Minority Interest Investment Gains/Losses Other Income/Charges 0 0 00 -9 -20 - 0 22 Income From Cont. Operations Extras & Discontinued...
Prepare common-sized balance sheet and income statements for the
company for 2017 and 2018. All values in millions except for per
share data. (In $, not %)
12/31/18 12/31/17 Sales Cost Of Goods Gross Profit Selling & Adminstrative & Depr. & Amort Expenses Income After Depreciation & Amortization Non-Operating Income Interest Expense Pretax Income -11 -21 -20 Income Taxes Minority Interest Investment Gains/Losses Other Income/Charges 0 0 00 -9 -20 - 0 22 Income From Cont. Operations Extras & Discontinued...
Most questions answered within 3 hours.
-
A resistor and the capacitor are used to control the timing in
the RC circuit of...
asked 10 minutes ago -
Five moles of monatomic ideal gas have initial pressure 2.50 ×
103 Pa and initial volume...
asked 10 minutes ago -
Living in a group could bring several disadvantages to an
individual. What are some of the...
asked 27 minutes ago -
Complete and balance the following reactions. In case of no
reaction occurring write NR.
Mix #1:...
asked 33 minutes ago -
If an economy consumes 75% of any increase in income, then an
increase in autonomous investment...
asked 36 minutes ago -
A shotputter throws the shot with an initial speed of 15.8 m/s
at a 38.0 ∘...
asked 52 minutes ago -
Debra and Merina sell electronic equipment and supplies through
their partnership. They wish to expand their...
asked 53 minutes ago -
How does a linear regression allow you to better estimate
trends, costs, and other factors in...
asked 1 hour ago -
1. (15%) Describe the difference between a pull (Kanban), push
and CONWIP production systems.
asked 57 minutes ago -
QUESTION 5
The total area under the Z distribution curve is equal to:
a.
10
b....
asked 1 hour ago -
Using Python
The variables x and y refer to numbers. Write a code segment
that prompts...
asked 1 hour ago -
If
the coefficient of static friction between a box and the floor is
0.35 with what...
asked 1 hour ago