

Homework Answers
As HOMEWORKLIB answering guideline I have answered only te first four subparts
I have used minitab software
Steps
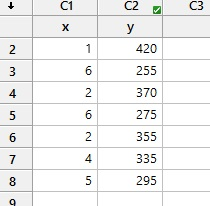
- Enter te data
- Stat-regression-regtression-fit regression model
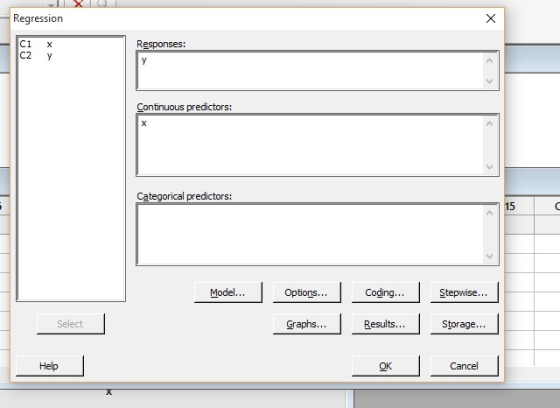
- ok


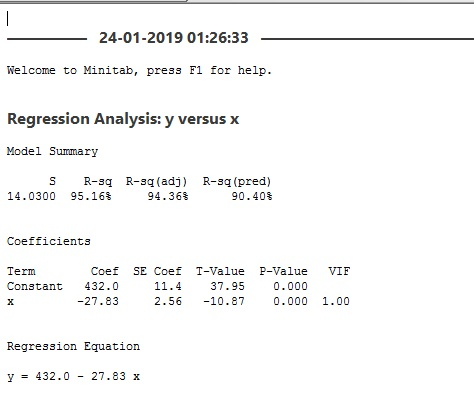
minitab out put
-----------------------------------------------------------------------------------------------
a)
---------------------------------------
b)
option C
----------------------------------------------------------------------------------------------
c)
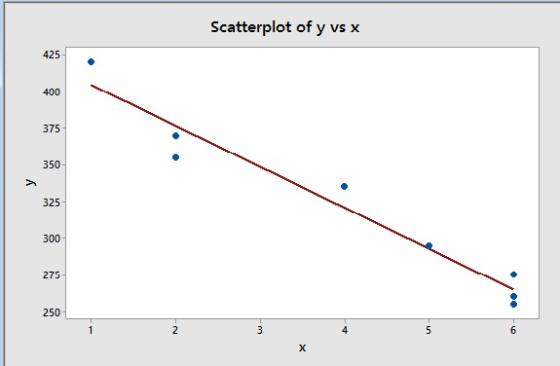
From the regression equation we can see that the slope is negetive
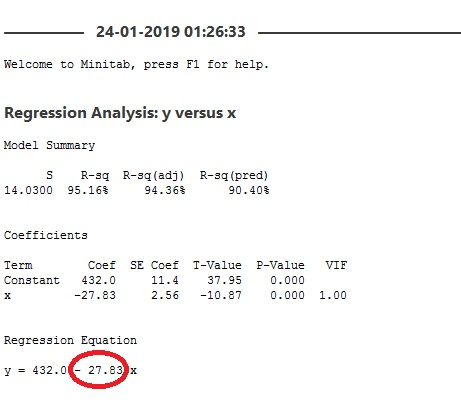
here a negetive relationsip exists between price and age
Price tends to decreas as age increases.
-----------------------------------------------------
d)
Age is independent variable and price is dependent variable.
So, Price is response variable and age is predictor variable.
option D
-----------------------------------------------------
PLEASE UPVOTE IF YOU LIKE MY ANSWER
THANK YOU
Add Answer to:
q8 Following are age and price data for 8 randomly selected ambulances between 1 and 6...
Following are age and price data for 8 randomly selected ambulances between 1 and 6 years...
Following are age and price data for 8 randomly selected ambulances between 1 and 6 years old. Here, x denotes age, in years, and y denotes price, in hundreds of dollars. Use the information to complete parts (a) through (f). x 6 1 6 2 6 2 4 5 y 280 410 255 350 250 370 335 300 a. Find the regression equation for the data points. ModifyingAbove y with caretyequals=nothingplus+nothingx (Round to two decimal places as needed.) b....
Following are chest size and weight data for 6 randomly selected bears. Here, x denotes chest...
 Following are chest size and weight data for 6 randomly selected bears. Here, x denotes chest size, in inches, and y denotes weight, in pounds. Use the information to complete parts (a) through (f). x 55 44 46 58 40 54 325 263 275 338 256 320 a. Find the regression equation for the data points. y= (Round to two decimal places as needed.) b. Graph the regression equation and the data points OA. 500 500 5007 Weight Weight Weight...
This Question: 1 pt 11 of 11 ( complete This Test: 11 pts possit tic: Question...
 This Question: 1 pt 11 of 11 ( complete This Test: 11 pts possit tic: Question Help Folowing are age and price data for randomly selected ambulances between 1 and 6 years old. Here, denotes ago, in years, and y denotos prio, in hundreds of dolars. Use the information to complete parts (a) through x 6 1 6 2. 6 2 4 5 Y 270 390 275 300280 365 315 300 a. Find the regression equation for the data points...
Following are age and price data for 8 randomly selected ambulances between 1 and 6 years...
 Following are age and price data for 8 randomly selected ambulances between 1 and 6 years old. Here, x denotes age, in years, and y denotes price, in hundreds of dollars. Use the information to complete parts (a) through () 6 y 280 400 275 360 255 365 325 300 a. Find the regression equation for the data points. (Round to two decimal places as needed.)
The data shown in the following scatterplot show a very nice relationship between the two variables....
 The data shown in the following scatterplot show a very nice relationship between the two variables. However, the correlation here is 0.03, very close to zero. Explain why we can have a nice relationship between two quantitative variables and yet have a correlation of O 8 10 14 O There are no outliers but there are influential observations that cause the value of r to be near 0. 0 There are strong outliers that cause the value of to be...
C2) The following data represent the age of the car and its price, in dollars, in one of the companies in some state. [ARI: 10 Marks] Price, in 1000 17.5 12 9.7 6.4 Car's age 10 (1 Marks) (4 M...
 C2) The following data represent the age of the car and its price, in dollars, in one of the companies in some state. [ARI: 10 Marks] Price, in 1000 17.5 12 9.7 6.4 Car's age 10 (1 Marks) (4 Marks) (3 Marks) (1 Marks) (1 Marks) a) Identify the independent and dependent variables. b) Find the correlation coefficient. Interpret the result. c) Find the estimated regression equation. d) Interpret the coefficients e) Predict the price of a car if it...
please do the new question, the completed one is an example of the steps it asks...
 please do the new question, the completed one is an example of
the steps it asks for.
Following are age and price data for 8 randomly selected ambulances between 1 and 6 years old. Here, x denotes age, in years, and y denotes price, in hundreds of dollars. Use the information to do parts (a) through (c) 2 4 250 420 265 350 260 360 310 305 2x-32. Zy-2520. Xxy-9255, andx2 a. Compute SST, SSR, and SSE, using the formulas,...
please do the new question, the completed one is an example of
the steps it asks for.
Following are age and price data for 8 randomly selected ambulances between 1 and 6 years old. Here, x denotes age, in years, and y denotes price, in hundreds of dollars. Use the information to do parts (a) through (c) 2 4 250 420 265 350 260 360 310 305 2x-32. Zy-2520. Xxy-9255, andx2 a. Compute SST, SSR, and SSE, using the formulas,...
The data for per capita income and per capita alcohol consumption for 66 countries is given...
The data for per capita income and per capita alcohol consumption for 66 countries is given in the table. Here, x denotes income, in thousands of dollars, and y denotes alcohol consumed, in gallons per year. Use the information to complete parts left parenthesis a right parenthesis through(a) through (d). x 20.4 22.6 26.6 19.1 27.3 24.3 y 20.8 29.7 28.4 15.7 20.3 31.0 a. Graph the data points. A. 1535050IncomeAlcohol A scatterplot has a horizontal axis labeled Income from...
Many countries, especially those in Burope, have significant gold holdings.
 Many countries, especially those in Burope, have significant gold holdings. But many of these countries also have massive debts. The following data show the total value of gold holdings in billions of U.S. dollars and the debt as a percentage of the gross domestic product for nine countries (WordPress and Trading Economics websites, February 24, 2012).a. Develop a scatter diagram for the total value of a country's gold holdings ($ billions) as the independent variable. b. What does the scatter diagram...
Please make sure you write the R cude, R-PROGRAM Data was collected in order to investigate...
 Please make sure you write the R cude,
R-PROGRAM
Data was collected in order to investigate the effect of temperature on the yield of a chemical process. Temperatures were set at eight specific levels, and the yield was determined for five replications at each evel 4. a. Identify the response variable and the predictor variable. Explain your reasoning b. Describe the two sources of variation (variation due to regression and variation about the regression) in terms of this particular problem...
Please make sure you write the R cude,
R-PROGRAM
Data was collected in order to investigate the effect of temperature on the yield of a chemical process. Temperatures were set at eight specific levels, and the yield was determined for five replications at each evel 4. a. Identify the response variable and the predictor variable. Explain your reasoning b. Describe the two sources of variation (variation due to regression and variation about the regression) in terms of this particular problem...
 Following are chest size and weight data for 6 randomly selected bears. Here, x denotes chest size, in inches, and y denotes weight, in pounds. Use the information to complete parts (a) through (f). x 55 44 46 58 40 54 325 263 275 338 256 320 a. Find the regression equation for the data points. y= (Round to two decimal places as needed.) b. Graph the regression equation and the data points OA. 500 500 5007 Weight Weight Weight...
 This Question: 1 pt 11 of 11 ( complete This Test: 11 pts possit tic: Question Help Folowing are age and price data for randomly selected ambulances between 1 and 6 years old. Here, denotes ago, in years, and y denotos prio, in hundreds of dolars. Use the information to complete parts (a) through x 6 1 6 2. 6 2 4 5 Y 270 390 275 300280 365 315 300 a. Find the regression equation for the data points...
 Following are age and price data for 8 randomly selected ambulances between 1 and 6 years old. Here, x denotes age, in years, and y denotes price, in hundreds of dollars. Use the information to complete parts (a) through () 6 y 280 400 275 360 255 365 325 300 a. Find the regression equation for the data points. (Round to two decimal places as needed.)
 The data shown in the following scatterplot show a very nice relationship between the two variables. However, the correlation here is 0.03, very close to zero. Explain why we can have a nice relationship between two quantitative variables and yet have a correlation of O 8 10 14 O There are no outliers but there are influential observations that cause the value of r to be near 0. 0 There are strong outliers that cause the value of to be...
 C2) The following data represent the age of the car and its price, in dollars, in one of the companies in some state. [ARI: 10 Marks] Price, in 1000 17.5 12 9.7 6.4 Car's age 10 (1 Marks) (4 Marks) (3 Marks) (1 Marks) (1 Marks) a) Identify the independent and dependent variables. b) Find the correlation coefficient. Interpret the result. c) Find the estimated regression equation. d) Interpret the coefficients e) Predict the price of a car if it...
 please do the new question, the completed one is an example of
the steps it asks for.
Following are age and price data for 8 randomly selected ambulances between 1 and 6 years old. Here, x denotes age, in years, and y denotes price, in hundreds of dollars. Use the information to do parts (a) through (c) 2 4 250 420 265 350 260 360 310 305 2x-32. Zy-2520. Xxy-9255, andx2 a. Compute SST, SSR, and SSE, using the formulas,...
please do the new question, the completed one is an example of
the steps it asks for.
Following are age and price data for 8 randomly selected ambulances between 1 and 6 years old. Here, x denotes age, in years, and y denotes price, in hundreds of dollars. Use the information to do parts (a) through (c) 2 4 250 420 265 350 260 360 310 305 2x-32. Zy-2520. Xxy-9255, andx2 a. Compute SST, SSR, and SSE, using the formulas,...
 Please make sure you write the R cude,
R-PROGRAM
Data was collected in order to investigate the effect of temperature on the yield of a chemical process. Temperatures were set at eight specific levels, and the yield was determined for five replications at each evel 4. a. Identify the response variable and the predictor variable. Explain your reasoning b. Describe the two sources of variation (variation due to regression and variation about the regression) in terms of this particular problem...
Please make sure you write the R cude,
R-PROGRAM
Data was collected in order to investigate the effect of temperature on the yield of a chemical process. Temperatures were set at eight specific levels, and the yield was determined for five replications at each evel 4. a. Identify the response variable and the predictor variable. Explain your reasoning b. Describe the two sources of variation (variation due to regression and variation about the regression) in terms of this particular problem...
Most questions answered within 3 hours.
-
a) Draw two water molecules.
b) Clearly name and label the type of bond that exists...
asked 58 minutes ago -
C - Language
Write a loop that sets each array element to the sum of itself...
asked 2 hours ago -
(63
#14)
which of the following statments best describes how chamging
the concentration of the substances...
asked 5 hours ago -
In the following reaction, which element is undergoing
oxidation: Na2SO3 + N2O --> N2 + Na2SO4...
asked 6 hours ago -
Which of the following pairs of ions have the same electron
configuration?
I: Br− and Se2−...
asked 9 hours ago -
The Foremost Composite Materials Company is planning a two-day
sales conference for October 19-20. The conference...
asked 9 hours ago -
3) Illustrate the observed pattern of relatedness of organisms
versus adaptations to specific conditions. This means...
asked 9 hours ago -
In winter a lake has a 0.35 m thick ice layer over 1.10 m of
water....
asked 10 hours ago -
Assuming the following has been encrypted with a Vigenere cipher
below, use the method(s) and assumptions...
asked 11 hours ago -
How would I use switch statements to write a program that will
take an input of...
asked 10 hours ago -
Imagine a reaction in which methane gas combusts at a constant
pressure of 1 atm and...
asked 11 hours ago -
Two parallel wires (each 12 m in length) are separated by a
distance of 0.065 m...
asked 11 hours ago