
please do the new question, the completed one is an example of the steps it asks for.
Homework Answers

Add Answer to:
please do the new question, the completed one is an example of
the steps it asks...
please complete the same questions (a-c) for the new question Following are chest size and weight...
 please complete the same questions (a-c) for the new
question
Following are chest size and weight data for 8 randomly selected bears. Here, x denotes chest size, in inches, and y denotes weight, in pounds. Use the information to do parts (a) through (c) x 55 44 46 58 4054 52 47 y 321259 286 332 257 322 335 300 ΣΧ-396, Σу-2412, ΣΧy-120,651, and ΣΧ2 = 19,870 y = 24 12, 〉 Xy = 120,651, and >x® = 19.870 a....
please complete the same questions (a-c) for the new
question
Following are chest size and weight data for 8 randomly selected bears. Here, x denotes chest size, in inches, and y denotes weight, in pounds. Use the information to do parts (a) through (c) x 55 44 46 58 4054 52 47 y 321259 286 332 257 322 335 300 ΣΧ-396, Σу-2412, ΣΧy-120,651, and ΣΧ2 = 19,870 y = 24 12, 〉 Xy = 120,651, and >x® = 19.870 a....
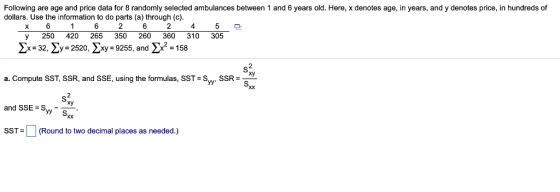
Following are age and price data for 8 randomly selected ambulances between 1 and 6 years...
 Following are age and price data for 8 randomly selected ambulances between 1 and 6 years old. Here, x denotes age, in years, and y denotes price, in hundreds of dollars. Use the information to complete parts (a) through () 6 y 280 400 275 360 255 365 325 300 a. Find the regression equation for the data points. (Round to two decimal places as needed.)
An instructor asked a random sample of eight students to record their study times at the...
 An instructor asked a random sample of eight students to record their study times at the beginning of a course. She then made a table for total hours studied (x) over 2 weeks and test score (y) at the end of the 2 weeks. The table is given below. Complete parts (a) through (d). X 11 1512 208 15 16 21 0 y 91 76 83 75 89 77 80 80 Ex= 118, Ey= 651, Exy = 9,464, Ex2 =...
Use the table and the given regression equation to answer parts (a)-(e). y = - 1.50...
 Use the table and the given regression equation to answer parts (a)-(e). y = - 1.50 a. Compute the three sums of squares, SST, SSR, and SSE, using the defining formulas. SSTEN (Type an integer or a decimal.) SSR=N (Type an integer or a decimal.) SSEN (Type an integer or a decimal.) b. Verify the regression identity, SST = SSR + SSE. Is this statement correct? O No O Yes c. Determine the value of the coefficient of determination. (Round...
q8 Following are age and price data for 8 randomly selected ambulances between 1 and 6...
 q8
Following are age and price data for 8 randomly selected ambulances between 1 and 6 years old. Here, x denotes age, in years, and y denotes price, in hundreds of dollars. Use the information to complete parts (a) through (f) y 260 420 255 370 275 355 335 295 a. Find the regression equation for the data points. (Round to two decimal places as needed.) b. Graph the regression equation and the data points. A. B. О с. D....
q8
Following are age and price data for 8 randomly selected ambulances between 1 and 6 years old. Here, x denotes age, in years, and y denotes price, in hundreds of dollars. Use the information to complete parts (a) through (f) y 260 420 255 370 275 355 335 295 a. Find the regression equation for the data points. (Round to two decimal places as needed.) b. Graph the regression equation and the data points. A. B. О с. D....
please show all the work. if you use excel please show the screenshots. Thank you !...
 please show all the work. if you use excel please show the
screenshots. Thank you !
I Question 2 (20pts) Consider the following set of ordered pairs. Complete parts a through c. у Х 1 3 5 4 10 8 4 a) Calculate the slope and y-intercept for these data. (Round to four decimal places as needed.) b) Calculate the total sum of squares (SST). (Round to two decimal place as needed.) c) Partition the sum of squares into the...
please show all the work. if you use excel please show the
screenshots. Thank you !
I Question 2 (20pts) Consider the following set of ordered pairs. Complete parts a through c. у Х 1 3 5 4 10 8 4 a) Calculate the slope and y-intercept for these data. (Round to four decimal places as needed.) b) Calculate the total sum of squares (SST). (Round to two decimal place as needed.) c) Partition the sum of squares into the...
Can you please answers these four questions as aoin as possible please and thank you! Given...
 Can you please answers these four questions as aoin as
possible please and thank you!
Given are five observations for two variables, z and y 5 13 20 18 48 57 11 27 a. Choose the corre rect scatter diagram for these data: A. B. 60+ 60 50 50 40 40 30+ 30 20 20 10 10- 10 20 30 40 50 60 x 10 20 30 40 50 60 57 x y 60 60 50+ 50- 40- 40+ 30-...
Can you please answers these four questions as aoin as
possible please and thank you!
Given are five observations for two variables, z and y 5 13 20 18 48 57 11 27 a. Choose the corre rect scatter diagram for these data: A. B. 60+ 60 50 50 40 40 30+ 30 20 20 10 10- 10 20 30 40 50 60 x 10 20 30 40 50 60 57 x y 60 60 50+ 50- 40- 40+ 30-...
This Question: 1 pt 11 of 11 ( complete This Test: 11 pts possit tic: Question...
 This Question: 1 pt 11 of 11 ( complete This Test: 11 pts possit tic: Question Help Folowing are age and price data for randomly selected ambulances between 1 and 6 years old. Here, denotes ago, in years, and y denotos prio, in hundreds of dolars. Use the information to complete parts (a) through x 6 1 6 2. 6 2 4 5 Y 270 390 275 300280 365 315 300 a. Find the regression equation for the data points...
The bullsh sentment of individual investors was 27.6% AAr Ja mal, measures were based on a...
 The bullsh sentment of individual investors was 27.6% AAr Ja mal, measures were based on a poll conducted by the American Association of Individual Investors. Assume that each bulish sentiment measure was based on a sample of 240 investors a. Develop a 95% conf dence interval for the dmerence between the bullish sentinert measures for the rost recent two weeks (to 3 de deals) February 2009). The bullsh sentment was reported to be 48.7% one week earier and 39.7% one...
please do the new one with all the 2 steps, completed one shows both the steps...
 please do the new one with all the 2 steps, completed one shows
both the steps it asks for
The following tables gives the population for a country, in millions of persons, for the years 1990-2009. Forecast the population in the years 2010 and 2011 Year1990 1991 1992 1993 1994 199519961997 1998 1999 Pop250|253257260 263|266269 273276279 Year 2000 | 2001| 2002 |2003|2004 | 2005 | 2006 | 2007| 2008| 2009 Pop 282 |285 288290293296299 302 304307 The forecast for 2010...
please do the new one with all the 2 steps, completed one shows
both the steps it asks for
The following tables gives the population for a country, in millions of persons, for the years 1990-2009. Forecast the population in the years 2010 and 2011 Year1990 1991 1992 1993 1994 199519961997 1998 1999 Pop250|253257260 263|266269 273276279 Year 2000 | 2001| 2002 |2003|2004 | 2005 | 2006 | 2007| 2008| 2009 Pop 282 |285 288290293296299 302 304307 The forecast for 2010...
 please complete the same questions (a-c) for the new
question
Following are chest size and weight data for 8 randomly selected bears. Here, x denotes chest size, in inches, and y denotes weight, in pounds. Use the information to do parts (a) through (c) x 55 44 46 58 4054 52 47 y 321259 286 332 257 322 335 300 ΣΧ-396, Σу-2412, ΣΧy-120,651, and ΣΧ2 = 19,870 y = 24 12, 〉 Xy = 120,651, and >x® = 19.870 a....
please complete the same questions (a-c) for the new
question
Following are chest size and weight data for 8 randomly selected bears. Here, x denotes chest size, in inches, and y denotes weight, in pounds. Use the information to do parts (a) through (c) x 55 44 46 58 4054 52 47 y 321259 286 332 257 322 335 300 ΣΧ-396, Σу-2412, ΣΧy-120,651, and ΣΧ2 = 19,870 y = 24 12, 〉 Xy = 120,651, and >x® = 19.870 a....
 Following are age and price data for 8 randomly selected ambulances between 1 and 6 years old. Here, x denotes age, in years, and y denotes price, in hundreds of dollars. Use the information to complete parts (a) through () 6 y 280 400 275 360 255 365 325 300 a. Find the regression equation for the data points. (Round to two decimal places as needed.)
 An instructor asked a random sample of eight students to record their study times at the beginning of a course. She then made a table for total hours studied (x) over 2 weeks and test score (y) at the end of the 2 weeks. The table is given below. Complete parts (a) through (d). X 11 1512 208 15 16 21 0 y 91 76 83 75 89 77 80 80 Ex= 118, Ey= 651, Exy = 9,464, Ex2 =...
 Use the table and the given regression equation to answer parts (a)-(e). y = - 1.50 a. Compute the three sums of squares, SST, SSR, and SSE, using the defining formulas. SSTEN (Type an integer or a decimal.) SSR=N (Type an integer or a decimal.) SSEN (Type an integer or a decimal.) b. Verify the regression identity, SST = SSR + SSE. Is this statement correct? O No O Yes c. Determine the value of the coefficient of determination. (Round...
 q8
Following are age and price data for 8 randomly selected ambulances between 1 and 6 years old. Here, x denotes age, in years, and y denotes price, in hundreds of dollars. Use the information to complete parts (a) through (f) y 260 420 255 370 275 355 335 295 a. Find the regression equation for the data points. (Round to two decimal places as needed.) b. Graph the regression equation and the data points. A. B. О с. D....
q8
Following are age and price data for 8 randomly selected ambulances between 1 and 6 years old. Here, x denotes age, in years, and y denotes price, in hundreds of dollars. Use the information to complete parts (a) through (f) y 260 420 255 370 275 355 335 295 a. Find the regression equation for the data points. (Round to two decimal places as needed.) b. Graph the regression equation and the data points. A. B. О с. D....
 please show all the work. if you use excel please show the
screenshots. Thank you !
I Question 2 (20pts) Consider the following set of ordered pairs. Complete parts a through c. у Х 1 3 5 4 10 8 4 a) Calculate the slope and y-intercept for these data. (Round to four decimal places as needed.) b) Calculate the total sum of squares (SST). (Round to two decimal place as needed.) c) Partition the sum of squares into the...
please show all the work. if you use excel please show the
screenshots. Thank you !
I Question 2 (20pts) Consider the following set of ordered pairs. Complete parts a through c. у Х 1 3 5 4 10 8 4 a) Calculate the slope and y-intercept for these data. (Round to four decimal places as needed.) b) Calculate the total sum of squares (SST). (Round to two decimal place as needed.) c) Partition the sum of squares into the...
 Can you please answers these four questions as aoin as
possible please and thank you!
Given are five observations for two variables, z and y 5 13 20 18 48 57 11 27 a. Choose the corre rect scatter diagram for these data: A. B. 60+ 60 50 50 40 40 30+ 30 20 20 10 10- 10 20 30 40 50 60 x 10 20 30 40 50 60 57 x y 60 60 50+ 50- 40- 40+ 30-...
Can you please answers these four questions as aoin as
possible please and thank you!
Given are five observations for two variables, z and y 5 13 20 18 48 57 11 27 a. Choose the corre rect scatter diagram for these data: A. B. 60+ 60 50 50 40 40 30+ 30 20 20 10 10- 10 20 30 40 50 60 x 10 20 30 40 50 60 57 x y 60 60 50+ 50- 40- 40+ 30-...
 This Question: 1 pt 11 of 11 ( complete This Test: 11 pts possit tic: Question Help Folowing are age and price data for randomly selected ambulances between 1 and 6 years old. Here, denotes ago, in years, and y denotos prio, in hundreds of dolars. Use the information to complete parts (a) through x 6 1 6 2. 6 2 4 5 Y 270 390 275 300280 365 315 300 a. Find the regression equation for the data points...
 The bullsh sentment of individual investors was 27.6% AAr Ja mal, measures were based on a poll conducted by the American Association of Individual Investors. Assume that each bulish sentiment measure was based on a sample of 240 investors a. Develop a 95% conf dence interval for the dmerence between the bullish sentinert measures for the rost recent two weeks (to 3 de deals) February 2009). The bullsh sentment was reported to be 48.7% one week earier and 39.7% one...
 please do the new one with all the 2 steps, completed one shows
both the steps it asks for
The following tables gives the population for a country, in millions of persons, for the years 1990-2009. Forecast the population in the years 2010 and 2011 Year1990 1991 1992 1993 1994 199519961997 1998 1999 Pop250|253257260 263|266269 273276279 Year 2000 | 2001| 2002 |2003|2004 | 2005 | 2006 | 2007| 2008| 2009 Pop 282 |285 288290293296299 302 304307 The forecast for 2010...
please do the new one with all the 2 steps, completed one shows
both the steps it asks for
The following tables gives the population for a country, in millions of persons, for the years 1990-2009. Forecast the population in the years 2010 and 2011 Year1990 1991 1992 1993 1994 199519961997 1998 1999 Pop250|253257260 263|266269 273276279 Year 2000 | 2001| 2002 |2003|2004 | 2005 | 2006 | 2007| 2008| 2009 Pop 282 |285 288290293296299 302 304307 The forecast for 2010...
Most questions answered within 3 hours.
-
Task 2.6 : In this exercise, you will create a script to
echo users, based on...
asked 37 seconds from now -
How are the activators and repressors different in eukaryotes vs
prokaryotes for regulation of gene expression?
asked 45 seconds ago -
The diameter of the Sun is 1.4x 10⁶ kilometers. (1 km
= 3280 ft) What is...
asked 3 minutes ago -
Calculate the value of the translational partition function of
O2 at 300 K for a volume...
asked 19 minutes ago -
Consider the following tasks, times, and predecessors for an
assembly of set top cable converter boxes:...
asked 18 minutes ago -
10.________ is the proportion of variance in the dependent
variable that is accounted for by the...
asked 31 minutes ago -
Find at least three implicit modelling assumptions or other
qualitative factors which are relevant but not...
asked 32 minutes ago -
Write a method that determines the key of the successor of the
root node in a...
asked 46 minutes ago -
Determine the lattice energy (in kJ/mol) of NaF(s),
using the data provided.
Energy to sublime Na(s)...
asked 54 minutes ago -
How do you explain the deviations from Hardy-Weinberg
equilibrium in a population where smoking has effected...
asked 1 hour ago -
As a general rule, testing should be conducted until all bugs
have been detected.
A. True....
asked 1 hour ago -
Just before a referendum on a school budget, a local newspaper
polls
436
voters to predict...
asked 1 hour ago