Step by step explanations are appreciated. I did MSC-MPC but I just got Q.
Homework Answers
Option (B).
Social outcome is obtained by equating Demand and MSC.
60 - Q = 2Q + 30
3Q = 30
Q = 10
P = 60 - 10 = $50
Market outcome is obtained by equating Demand and MPC.
60 - Q = Q + 30
2Q = 30
Q = 15
When Q = 15,
MSC = (2 x 15) + 30 = 30 + 30 = $60
MPC = 15 + 30 = $45
Deadweight loss = (1/2) x (MSC - MPC) x Change in output = (1/2) x $(60 - 45) x (15 - 10) = (1/2) x $15 x 5 = $37.5
Add Answer to:
Step by step explanations are appreciated. I did MSC-MPC but I just got Q. An environmental...
Steo by step explanations are appreciated Thank you An environmental economic consulting firm is hired to...
 Steo by step explanations are appreciated Thank you
An environmental economic consulting firm is hired to measure the negative externalities associated with the pollution from an industry. The consultants calculate the marginal social cost of production to be MSC 20+30 and the marginal private cost of production to be MPC-Q+30. The market demand curve can be expressed as P 60-Q. The sum of the consumer surplus plus producer surplus at the market equilibrium (i.e. the equilibrium where production decisions do...
Steo by step explanations are appreciated Thank you
An environmental economic consulting firm is hired to measure the negative externalities associated with the pollution from an industry. The consultants calculate the marginal social cost of production to be MSC 20+30 and the marginal private cost of production to be MPC-Q+30. The market demand curve can be expressed as P 60-Q. The sum of the consumer surplus plus producer surplus at the market equilibrium (i.e. the equilibrium where production decisions do...
An environmental economic consulting firm is hired to measure the negative externalities associated with the pollution...
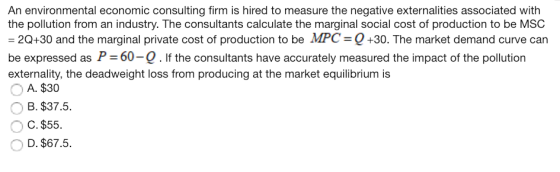
An environmental economic consulting firm is hired to measure the negative externalities associated with the pollution from an industry. The consultants calculate the marginal social cost of production to be MSC = 2Q+30 and the marginal private cost of production to be MPC =2Q +30. The market demand curve can be expressed as P=60 - Q . If the consultants have accurately measured the impact of the pollution externality, the net social benefit of producing at the social optimum (rather...
An environmental economic consulting firm is hired to measure the negative externalities associated with the pollution...
 An environmental economic consulting firm is hired to measure the negative externalities associated with the pollution from an industry. The consultants calculate the marginal social cost of production to be MSC 20+30 and the marginal private cost of production to be MPC-Q+30. The market demand curve can be expressed as P 60-Q. production decisions do not take into account the externality) is: The net social benefit at the market equilibrium (i.e. the equilibrium where A. $150 B. $0 C. $225...
An environmental economic consulting firm is hired to measure the negative externalities associated with the pollution...
 An environmental economic consulting firm is hired to measure the negative externalities associated with the pollution from an industry. The consultants calculate the marginal social cost of production to be MSC-2Q+30 and the marginal private cost of production to be MPC-+30. The market demand curve for the industry can be expressed as P- 60-Q. If the industry currently does not take into account the negative externality in its supply decisions, the industry is the social optimum. a) under-producing; 5 b)...
Steel production from a mill generates a negative externality because of the environmental damage linked to...
Steel production from a mill generates a negative externality because of the environmental damage linked to air and water pollution. Suppose the market demand and supply curves are given by: Demand (MB): P = 400 - 3Qd Supply (MC): P = 200 + Qs Q is tons of steel and P is price per ton of steel. Note in this form, the demand and supply curve are solved for P -- you can see directly the lines on our supply and demand...
Question Completion Status: QUESTION 1 You are in charge of a study of the tobacco industry...
 Question Completion Status: QUESTION 1 You are in charge of a study of the tobacco industry and its effects on society. Your team of environmental economist de is a good that produces a negative externality) and divided the project in 2 steps: decided to approach this with the theory of externalities (Recall, tobacco Step 1: Find the market equilibrium of the industry. A competitive eauilibrium is found using the following functions Demand Marginal Private Benefit (MPB)- 60 3Q Supply Marginal...
Part I Suppose that in the market for paper, demand is P=100 - Q. The marginal private cost of producing paper is 10+ Q...
 Part I Suppose that in the market for paper, demand is P=100 - Q. The marginal private cost of producing paper is 10+ Q. However, pollution generated by the production process creates a per unit external harm (i.e., negative externality) equal to 0.5Q (i.e., the level of the externality increases with the quantity produced). 16+1,5 Q (Social cret) 10+Q (private 0 36 45 Top a) What is the (unregulated) market equilibrium and quantity if the externality is not corrected for...
Externalities II [Warning, this problem is an enhanced version of a negative externality problem. While I...
Externalities II [Warning, this problem is an enhanced version of a negative externality problem. While I break it down into a series of short steps, it still may take a long time to figure out. Budget accordingly. Don’t skimp on your graph. Your picture will hopefully help you understand what is going on.] High levels of automobile traffic in big cities are incredibly costly to society. Time spent idling in a car is time that could probably have been spent...
 Steo by step explanations are appreciated Thank you
An environmental economic consulting firm is hired to measure the negative externalities associated with the pollution from an industry. The consultants calculate the marginal social cost of production to be MSC 20+30 and the marginal private cost of production to be MPC-Q+30. The market demand curve can be expressed as P 60-Q. The sum of the consumer surplus plus producer surplus at the market equilibrium (i.e. the equilibrium where production decisions do...
Steo by step explanations are appreciated Thank you
An environmental economic consulting firm is hired to measure the negative externalities associated with the pollution from an industry. The consultants calculate the marginal social cost of production to be MSC 20+30 and the marginal private cost of production to be MPC-Q+30. The market demand curve can be expressed as P 60-Q. The sum of the consumer surplus plus producer surplus at the market equilibrium (i.e. the equilibrium where production decisions do...
 An environmental economic consulting firm is hired to measure the negative externalities associated with the pollution from an industry. The consultants calculate the marginal social cost of production to be MSC 20+30 and the marginal private cost of production to be MPC-Q+30. The market demand curve can be expressed as P 60-Q. production decisions do not take into account the externality) is: The net social benefit at the market equilibrium (i.e. the equilibrium where A. $150 B. $0 C. $225...
 An environmental economic consulting firm is hired to measure the negative externalities associated with the pollution from an industry. The consultants calculate the marginal social cost of production to be MSC-2Q+30 and the marginal private cost of production to be MPC-+30. The market demand curve for the industry can be expressed as P- 60-Q. If the industry currently does not take into account the negative externality in its supply decisions, the industry is the social optimum. a) under-producing; 5 b)...
 Question Completion Status: QUESTION 1 You are in charge of a study of the tobacco industry and its effects on society. Your team of environmental economist de is a good that produces a negative externality) and divided the project in 2 steps: decided to approach this with the theory of externalities (Recall, tobacco Step 1: Find the market equilibrium of the industry. A competitive eauilibrium is found using the following functions Demand Marginal Private Benefit (MPB)- 60 3Q Supply Marginal...
 Part I Suppose that in the market for paper, demand is P=100 - Q. The marginal private cost of producing paper is 10+ Q. However, pollution generated by the production process creates a per unit external harm (i.e., negative externality) equal to 0.5Q (i.e., the level of the externality increases with the quantity produced). 16+1,5 Q (Social cret) 10+Q (private 0 36 45 Top a) What is the (unregulated) market equilibrium and quantity if the externality is not corrected for...
Most questions answered within 3 hours.
-
Currently, GH Co. sells 42,600 handbags annually at an average
price of $149 each. It is...
asked 9 minutes ago -
A boy of mass 60 kg and a girl of mass 40 kg are together and...
asked 12 minutes ago -
Which of the following best describes transferred-in costs?
A) they are the cost of transferring products...
asked 22 minutes ago -
Programming in C:
Write a program that accepts an integer and two floating-point
values (All three...
asked 25 minutes ago -
In hypothesis testing, it is easier to reject H0 with
a ______________
directional test (one tail)...
asked 41 minutes ago -
Requirements:
For this exercise you are to implement a small bioinformatics
library for operations with DNA...
asked 32 minutes ago -
The stockholders’ equity section of Concord Corporation’s
balance sheet at December 31 is presented here.
CONCORD...
asked 35 minutes ago -
many biochemical dissolve in the aqueous media of the cell. What
does this imply about the...
asked 43 minutes ago -
Explain how to uphold conditions relating to the work environment,
equipment, materials, procedures and special requirements
asked 41 minutes ago -
The probability of a manufacturing defect in an aluminum
beverage can is .00008 if 100,600 cans...
asked 45 minutes ago -
Which aqueous solution below is most acidic?
a. pH= 3.00
c. [-OH]= 2 x 10^-3
b....
asked 1 hour ago -
There are four (4) major financial statements: Income Statement,
Retained Earning (Owner's Equity) Statement, Balance Sheet,...
asked 1 hour ago