2. One personality dimension that seems well recognized by most people is that of introversion-extroversion. Extroverts...
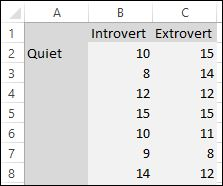
2. One personality dimension that seems well recognized by most people is that of introversion-extroversion. Extroverts are described as outgoing, sociable, and fun-loving, whereas introverts are described as reserved and less sociable. Because introverts seem more directed toward their own thoughts and ideas, we might suspect that introverts and extroverts may respond differently to external stimulation such as noise. To more fully investigate this issue, Standing, Lynn, and Moxness (1990) used a 2 ✕ 2 between-subjects design to vary personality type (factor A), introverts and extroverts, and background noise (factor B), quiet and noisy, while subjects performed a reading comprehension task. Suppose you conducted a similar study with 12 subjects per cell, and each person completed a 15 item true-false reading comprehension task. A person’s score was the number of items correctly answered. You obtained the following scores:
|
Personality Type (A) |
||
|
Introvert |
Extrovert |
|
|
Quiet |
10 |
15 |
|
8 |
14 |
|
|
12 |
12 |
|
|
15 |
15 |
|
|
10 |
11 |
|
|
9 |
8 |
|
|
14 |
12 |
|
|
13 |
8 |
|
|
14 |
13 |
|
|
7 |
10 |
|
|
12 |
9 |
|
|
11 |
11 |
|
|
Background Noise (B) |
||
|
Noisy |
6 |
13 |
|
8 |
8 |
|
|
11 |
9 |
|
|
4 |
14 |
|
|
5 |
13 |
|
|
8 |
12 |
|
|
9 |
15 |
|
|
10 |
11 |
|
|
9 |
9 |
|
|
10 |
11 |
|
|
7 |
12 |
|
|
11 |
10 |
|
2.a.What is the relationship between personality type and the effect of background noise? Use α= .05. If an interaction occurred, use the Tukey HSD test for the simple effects.
2.b.Plot the cell means with the appropriate labelling. You can draw this by hand.
2.c.Report the results as it would appear in a research paper.
Homework Answers
The two factor ANOVA analysis is performed in EXCEL by following these steps;
Step 1: Write the data value in excel. The screenshot is shown below;
Step 2: Data>Data Analysis>Two-Factor With Replication>OK. The screenshot is shown below:

Step 3: Select Input Range: All the data, Rows per sample: 12. For Alpha value = 0.05 at 5% significance level. The screenshot is shown below;

The ANOVA table is obtained. The screenshot is shown below;


a)
From the ANOVA table,
| ANOVA | ||||
| Source of Variation | P-value |
 |
Decision | |
| Interaction | 0.033232 | < | 0.05 | Significant |
The P-value for the interaction between personality type and the effect of background noise is less than 0.05 at 5% significance level. Hence the null hypothesis is rejected. Now, it can be concluded that there is a significant relationship between these two factors.
Tuckey HSD test
Now, to test the significance of simple effects of both the factor, Tuckey HSD test is performed in following steps,
For personality type
The null hypothesis is defined as,
H0: All the means for personality type are equal
The HSD for each comparison are obtained using the formula,

Where,
The q value is obtained from studentized q distribution table for number of groups, k = 2, degree of freedom = n-k = 48 - 2 = 46 and significance level = 0.05.

The MSE is obtained from the ANOVA for factor personality test,


The decision rule states that if;

From the ANOVA table,
| Introvert | Extrovert | |
| Average | 9.708333 | 11.45833 |


Since the absolute difference is less than HSD, the null hypothesis is not rejected. It can concluded that there is no simple effect of personality type.
For background noise
The null hypothesis is defined as,
H0: All the means for background noise are equal
The HSD for each comparison is,

Where,
The q value is obtained from studentized q distribution table for number of groups, k = 2, degree of freedom = n-k = 48 - 2 = 46 and significance level = 0.05.

The MSE is obtained from the ANOVA for factor personality test,


From the ANOVA table,
| Average | |
| Quiet | 11.375 |
| Noise | 9.791667 |


Since the absolute difference is less than HSD, the null hypothesis is not rejected. It can concluded that there is no simple effect of noise type.
b)
| Introvert | Extrovert | Average | |
| Quiet | 11.25 | 11.5 | 11.375 |
| Noise | 8.166667 | 11.41667 | 9.791667 |
| Average | 9.708333 | 11.45833 |
The plot is obtained in excel. The screenshot is shown below,

c)
Interaction: The parallel plot shown no interaction while non parallel plot shows interaction between two groups. From the plot we can see that there is an interaction between two groups personality type and background noise.
Simple effect: For each line we can see that there is a very small difference between the groups of Quiet and and Noise as well which indicate very little of no simple effect.
Add Answer to:
2. One personality dimension that seems well recognized by most
people is that of introversion-extroversion. Extroverts...
We will be constructing confidence intervals for the proportion of each color as well as the...
We will be constructing confidence intervals for the proportion of each color as well as the mean number of candies per bag. You will use the methods of 9.1 for the proportions and 9.2 for the mean. Remember that you can use Excel (or your calculator) to do many of the preliminary calculations 1). Construct a 95% Confidence Interval for the mean total number of candies (large samples). (2). Construct a 95% Confidence Interval for the proportion of blue M&Ms®...
Are all disciplines in the University equally boring or there are some more boring than others? To...
Are all disciplines in the University equally boring or there are some more boring than others? To answer that question, a study performed at Columbia University counted the number of times per 5-minute interval when professors from three different departments said “uh” or “ah” during lectures to fill gaps between words. These counts were used as a proxy (approximation) for the measure of class boredom. The data from observing one hundred of 5-minute intervals from each of three departments’ professors were recorded in...
A study of reading comprehension in children compared three methods of instruction. The three methods of...
A study of reading comprehension in children compared three methods of instruction. The three methods of instruction are called Basal, DRTA, and Strategies. As is common in such studies, several pretest variables were measured before any instruction was given. One purpose of the pretest was to see if the three groups of children were similar in their comprehension skills. The READING data set described in the Data Appendix gives two pretest measures that were used in this study. Use one-way...
2 3 S1 0 1 0 114 4 13 1 0 15 7 2 4 1...
 2 3 S1 0 1 0 114 4 13 1 0 15 7 2 4 1 14 3|15 12 8 4 5 6 7 8 9 10 11 12 13 14 15 1 2 15 11 8 3 10 6 12 5 9 0 7 4 14 2 13 1 10 6 12 11 9 5 3 8 8 13 6 2 11 15 12 9 7 3 10 5 0 2 4 9 1 7 5 11 0 6...
Consider the following project: Task ID Duration (Days) Predecessors 2 70 - 3 30 2 4...
Consider the following project: Task ID Duration (Days) Predecessors 2 70 - 3 30 2 4 120 3 5 120 2 6 120 5 7 120 3,6 8 150 3,6 9 115 3,6 10 130 7,9 11 90 7,9 12 30 7,9 13 120 7,9 14 75 10 15 30 14 16 85 6 17 165 16 18 90 16 19 90 17,18 20 20 8,11,13,15,19 What is the slack for task 8?
1. Consider the following table providing the needed tasks to completing a successful project. Th...
 1. Consider the following table providing the needed tasks to completing a successful project. The first column provides the name of the task, the second column states the time to complete that task and the third column tells when a task can begin. Task Time to Condition to start task complete #1 #2 #3 #4 #5 #6 #7 #8 #9 #10 #11 #12 #13 #14 #15 #16 #17 #18 #19 7 days None 5 days 8 daysNone 4 days 3...
Task 2 (LO 1: 1.2) Briefly explain the operating sequence of the pneumatic and electro pneumatic ...
 Task 2 (LO 1: 1.2)
Briefly explain the operating sequence of the pneumatic and
electro pneumatic circuit diagrams
given below.
S2 Y2 +24V 1 2 3 4 6 7 ε 9 10 11 12 13 14 15 16 S5 HS Oy 軍軍 10 We were unable to transcribe this image
S2 Y2 +24V 1 2 3 4 6 7 ε 9 10 11 12 13 14 15 16 S5 HS Oy 軍軍 10
Task 2 (LO 1: 1.2)
Briefly explain the operating sequence of the pneumatic and
electro pneumatic circuit diagrams
given below.
S2 Y2 +24V 1 2 3 4 6 7 ε 9 10 11 12 13 14 15 16 S5 HS Oy 軍軍 10 We were unable to transcribe this image
S2 Y2 +24V 1 2 3 4 6 7 ε 9 10 11 12 13 14 15 16 S5 HS Oy 軍軍 10
0.5 points QUESTION 44 5. 2. 3. Front view Correctly label the female reproductive system: 1....
 0.5 points QUESTION 44 5. 2. 3. Front view Correctly label the female reproductive system: 1. 2. 3. 4. and 5,. 2.5 points QUESTION 45 7. 15. 14 8. 13. 9 12. 10. 11 Side view Correctly label the female reproductive system: 6. 7. 8 9, 10, 11, 12. 13, 14. 15. NOTE: #8, 10, and 12 are not part of the reproductive system 5 points QUESTION 46 2. 11 10. 9. S1de view 7. Correctly label the male reproductive...
The following frequency table represents the ages of children living in one apartment complex for 56...
The following frequency table represents the ages of children living in one apartment complex for 56 children. What is the 3rd quartile of the data? 1 1 2 2 3 3 3 3 4 4 5 5 5 5 6 6 6 8 8 8 9 9 9 9 9 9 10 10 11 11 11 11 11 11 12 12 12 13 13 13 14 15 15 16 16 16 17 17 18 18 18 18 18 18 18...
 2 3 S1 0 1 0 114 4 13 1 0 15 7 2 4 1 14 3|15 12 8 4 5 6 7 8 9 10 11 12 13 14 15 1 2 15 11 8 3 10 6 12 5 9 0 7 4 14 2 13 1 10 6 12 11 9 5 3 8 8 13 6 2 11 15 12 9 7 3 10 5 0 2 4 9 1 7 5 11 0 6...
 1. Consider the following table providing the needed tasks to completing a successful project. The first column provides the name of the task, the second column states the time to complete that task and the third column tells when a task can begin. Task Time to Condition to start task complete #1 #2 #3 #4 #5 #6 #7 #8 #9 #10 #11 #12 #13 #14 #15 #16 #17 #18 #19 7 days None 5 days 8 daysNone 4 days 3...
 Task 2 (LO 1: 1.2)
Briefly explain the operating sequence of the pneumatic and
electro pneumatic circuit diagrams
given below.
S2 Y2 +24V 1 2 3 4 6 7 ε 9 10 11 12 13 14 15 16 S5 HS Oy 軍軍 10 We were unable to transcribe this image
S2 Y2 +24V 1 2 3 4 6 7 ε 9 10 11 12 13 14 15 16 S5 HS Oy 軍軍 10
Task 2 (LO 1: 1.2)
Briefly explain the operating sequence of the pneumatic and
electro pneumatic circuit diagrams
given below.
S2 Y2 +24V 1 2 3 4 6 7 ε 9 10 11 12 13 14 15 16 S5 HS Oy 軍軍 10 We were unable to transcribe this image
S2 Y2 +24V 1 2 3 4 6 7 ε 9 10 11 12 13 14 15 16 S5 HS Oy 軍軍 10
 0.5 points QUESTION 44 5. 2. 3. Front view Correctly label the female reproductive system: 1. 2. 3. 4. and 5,. 2.5 points QUESTION 45 7. 15. 14 8. 13. 9 12. 10. 11 Side view Correctly label the female reproductive system: 6. 7. 8 9, 10, 11, 12. 13, 14. 15. NOTE: #8, 10, and 12 are not part of the reproductive system 5 points QUESTION 46 2. 11 10. 9. S1de view 7. Correctly label the male reproductive...
Most questions answered within 3 hours.
-
The blues made its way into many kinds of music. Eric Clapton,
The Beatles, and Elvis...
asked 22 minutes ago -
If you’re standing at the bottom of a hill and asked to evaluate
it while being...
asked 1 hour ago -
1. Which region has taken the lead in the world of
e-waste handling?
a) European Union...
asked 1 hour ago -
A 8.15- g bullet from a 9-mm pistol has a velocity of 366.0 m/s.
It strikes...
asked 2 hours ago -
The outstanding bonds of Alpha Extracts have a yield to maturity
of 7.4 percent and a...
asked 2 hours ago -
The Problem: The Case of the Harmonizing Vacations
Your CEO is exploring partnering with a European...
asked 4 hours ago -
A chemical equation is balanced by adding coefficients in front
of some formulas so that the...
asked 4 hours ago -
From the literature (reference your sources): What are the
lattice parameters of calcite and aragonite? Why...
asked 4 hours ago -
Your system is rejecting the question am asking which is
preceded by a case study. It...
asked 4 hours ago -
3. On January 2, 2000, Larry creates a trust with himself as
trustee. Larry as trustee...
asked 4 hours ago -
A member of the volleyball team spikes the ball. During this
process, she changes the velocity...
asked 4 hours ago -
Are adult gamers less likely to use a gaming console (Xbox,
PlayStation, Wii, etc...) than teen...
asked 5 hours ago