
Homework Answers


Add Answer to:
7. Single sideband (SSB) signals can be generated in two ways. In this problem you will...
4.2.1 For each of the baseband signals: (i) m(t) = cos 1000πι; (ii) m(1) = 2cos...
 4.2.1 For each of the baseband signals: (i) m(t) = cos 1000πι; (ii) m(1) = 2cos sin 2000Tr; (ii) m(t) cos 1000t t cos 3000T t, do the following. (a) Sketch the spectrum of mt). (b) Sketch the spectrum of the DSB-SC signal mt) cos 10.000π. (c) Identify the upper sideband (USB) and the lower sideband (LSB) spectra. (d) Identify the frequencies in the baseband, and the corresponding frequencies in the DSB-SC USB, and LSB spectra. Explain the nature of...
Cny e upper sldeband (uSB) and lower sideband (LSB) spectra. (5 polnts) Al 2. Figure-1 below show...
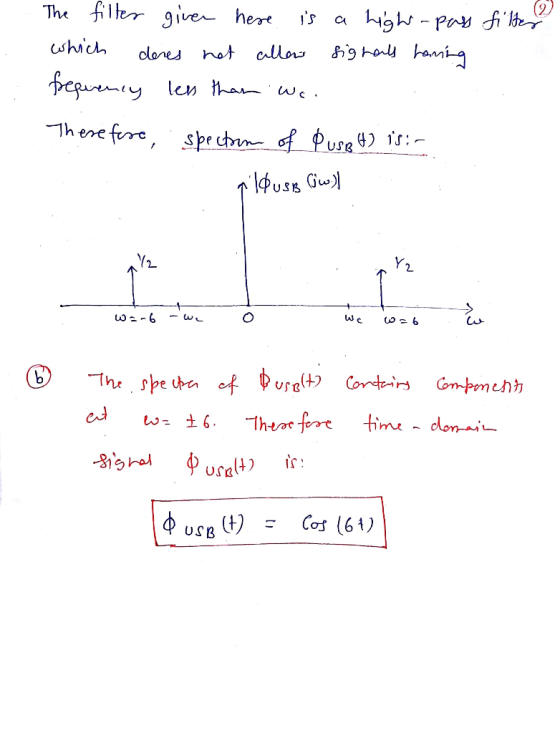
 Cny e upper sldeband (uSB) and lower sideband (LSB) spectra. (5 polnts) Al 2. Figure-1 below shows a DSB-SC modulator. The carrier avaliable at the multiplier is a distorted sinusoid given by c(t)- Cos3(wet). The spectrum of m(t) is shown in Figure-2 M(f) m(t) Fllter -В c(t) Figure-2 Figure 1 a. Determine the signals and sketch their spectra at points b and c. (5 points). b. What kind of filter is required in Figure-1? Verify your answer. (5 points). c....
1. Given a baseband signal m(t) sin(1000mt) cos(3000nt) + cos(3700nt a. Sketch the spectrum of m(...
 1. Given a baseband signal m(t) sin(1000mt) cos(3000nt) + cos(3700nt a. Sketch the spectrum of m(t) (Hint. sin(a) cos(b) 0.5 sin(a +b) +0.5sin a-b)) b. Sketch the spectrum of DSB-CS signal m(t)cos(10000mt) C ldentify the upper sideband {USB) and lower sideband (LSB) spectra d. Give the black diagram of the receiver to receive DSB-CS signal in (b). 2. baseband signal m(r)--0.5 + Σ..小(t-n)-u(t-0.5-n)] where ult) is the Given unit step function, an amplitude modulated signal is as SAM 107+ m(0cos...
4.4-6 An LSB signal is demodulated coherently, as shown in Fig. P4.4-6. Unfortunately, because of the...
 4.4-6 An LSB signal is demodulated coherently, as shown in Fig. P4.4-6. Unfortunately, because of the transmission delay, the received signal carrier is not 2 cos Wet as sent, but rather, is 2 cos[wc + Aw)t + 8). The local oscillator is still cos wct. Show the following. (a) When 8 = 0, the output y(t) is the signal m(t) with all its spectral components shifted (offset) by Ao. Hint: Observe that the output y(t) is identical to the right-hand...
When the message signal m (t) =cos (2π fmt) and the carrier signal is c(t)=cos (2π fct) , fm<&...
 When the message signal m (t) =cos (2π fmt) and the
carrier signal is c(t)=cos (2π fct) ,
fm<< fc,
The modulated DSB-SC signal
SDSB-SC=m(t)cos(2πfct) is generated, and only
the upper sideband
To generate and transmit the SSB signal. As shown in the figure
below, the receiver is a local oscillator
cosine signal to the received signal and passes it through a
low-pass filter. Answer the following questions.
(a) Draw the waveform of DSB-SC modulated signal
SDSB-SC(t)
(b)Find the result...
When the message signal m (t) =cos (2π fmt) and the
carrier signal is c(t)=cos (2π fct) ,
fm<< fc,
The modulated DSB-SC signal
SDSB-SC=m(t)cos(2πfct) is generated, and only
the upper sideband
To generate and transmit the SSB signal. As shown in the figure
below, the receiver is a local oscillator
cosine signal to the received signal and passes it through a
low-pass filter. Answer the following questions.
(a) Draw the waveform of DSB-SC modulated signal
SDSB-SC(t)
(b)Find the result...
Make sure you show all working and describe each step in your calculations. 1. A signum function ...
 signals and communications 2
Make sure you show all working and describe each step in your calculations. 1. A signum function is defined as sgn(t) = { 1、12 0 1 t<0 Plot and express this function in terms of the unit-step function. 5 marks/ Determine and plot the even and odd parts of the signal 2. x(t) (te-3 +2)u(t). 5 marks 3. If prove that y[n-m] = x[n-m] * h[n]. 5 marks 4. Assuming α > 0, plot the signal...
signals and communications 2
Make sure you show all working and describe each step in your calculations. 1. A signum function is defined as sgn(t) = { 1、12 0 1 t<0 Plot and express this function in terms of the unit-step function. 5 marks/ Determine and plot the even and odd parts of the signal 2. x(t) (te-3 +2)u(t). 5 marks 3. If prove that y[n-m] = x[n-m] * h[n]. 5 marks 4. Assuming α > 0, plot the signal...
Problem 17. Consider the standard amplitude-modulation system shown in Figure 3 Figure 3 x) Chann...
 Analysis Linear Systems
Problem 17. Consider the standard amplitude-modulation system shown in Figure 3 Figure 3 x) Channel Filter he(r) cos wor cos ωοι M(w) H(u) (a) Sketch the spectrum of r(t). (b) Sketch the spectrum of y(t) for the following cases: (i) 0S WcWo-m (iii) wc >wowm (c) Sketch the spectrum of z(t) for the following cases: (i) 0 S WcWo-m (iii) wc >wowm d) Sketch the spectrum of v(t) if we wowm and (i) w
Analysis Linear Systems
Problem 17. Consider the standard amplitude-modulation system shown in Figure 3 Figure 3 x) Channel Filter he(r) cos wor cos ωοι M(w) H(u) (a) Sketch the spectrum of r(t). (b) Sketch the spectrum of y(t) for the following cases: (i) 0S WcWo-m (iii) wc >wowm (c) Sketch the spectrum of z(t) for the following cases: (i) 0 S WcWo-m (iii) wc >wowm d) Sketch the spectrum of v(t) if we wowm and (i) w
can you please solve this problem step by step, thank you!! 1. Consider a DSB-SC signal...
 can you please solve this problem step by step, thank
you!!
1. Consider a DSB-SC signal with noise passes through a demodulator shown below. ViC0) 2(0) но но 0) The input signal plus noise is v,(t)-5,() + n'(t) where 5,0): Am(1)cos2r/rt, m(1) cos 2π/J is the message signal with f-</м , carrier frequency is f> fe , and noise n' (r) has power spectral density function G,じ)= η . The local carrier is v,(1)s 2 cosZrw. The carrier filter is...
can you please solve this problem step by step, thank
you!!
1. Consider a DSB-SC signal with noise passes through a demodulator shown below. ViC0) 2(0) но но 0) The input signal plus noise is v,(t)-5,() + n'(t) where 5,0): Am(1)cos2r/rt, m(1) cos 2π/J is the message signal with f-</м , carrier frequency is f> fe , and noise n' (r) has power spectral density function G,じ)= η . The local carrier is v,(1)s 2 cosZrw. The carrier filter is...
This is taken from Section 4.6, "Amplitude Modulation and the Continuous-Time Fourier Transform," in the course...
 This is taken from Section 4.6, "Amplitude Modulation and the
Continuous-Time Fourier Transform," in the course text Computer
Explorations in signals and systems by Buck, Daniel, Singer, 2nd
Edition. I need the answers for the basic and intermediate
questions.
4.6 Amplitude Modulation and the Continuous-Time Fouriei Transform This exercise will explore amplitude modulation of Morse code messages. A simple ampli tude modulation system can be described by x(t) = m(t) cos(Crfot), (4.13) where m(t) is called the message waveform and...
This is taken from Section 4.6, "Amplitude Modulation and the
Continuous-Time Fourier Transform," in the course text Computer
Explorations in signals and systems by Buck, Daniel, Singer, 2nd
Edition. I need the answers for the basic and intermediate
questions.
4.6 Amplitude Modulation and the Continuous-Time Fouriei Transform This exercise will explore amplitude modulation of Morse code messages. A simple ampli tude modulation system can be described by x(t) = m(t) cos(Crfot), (4.13) where m(t) is called the message waveform and...
can someone help me do this and maybe also the picture of the scope explain how you get it. thankyou! Frequency-sh...
 can someone help me do this and maybe also the picture of the
scope explain how you get it. thankyou!
Frequency-shift keying (FSK) and Phase-shift keying (PSK) Two other modulation schemes are the phase-shift keying (PSK) and the frequency-shift keying (FSK). These are illustrated in Figure 8 b and c respectively. In phase-shift keying the carrier signal changes phase by a radians when the digital signal changes values. In frequency-shift keying a 0 is transmitted at a different carrier frequency...
can someone help me do this and maybe also the picture of the
scope explain how you get it. thankyou!
Frequency-shift keying (FSK) and Phase-shift keying (PSK) Two other modulation schemes are the phase-shift keying (PSK) and the frequency-shift keying (FSK). These are illustrated in Figure 8 b and c respectively. In phase-shift keying the carrier signal changes phase by a radians when the digital signal changes values. In frequency-shift keying a 0 is transmitted at a different carrier frequency...
 4.2.1 For each of the baseband signals: (i) m(t) = cos 1000πι; (ii) m(1) = 2cos sin 2000Tr; (ii) m(t) cos 1000t t cos 3000T t, do the following. (a) Sketch the spectrum of mt). (b) Sketch the spectrum of the DSB-SC signal mt) cos 10.000π. (c) Identify the upper sideband (USB) and the lower sideband (LSB) spectra. (d) Identify the frequencies in the baseband, and the corresponding frequencies in the DSB-SC USB, and LSB spectra. Explain the nature of...
 Cny e upper sldeband (uSB) and lower sideband (LSB) spectra. (5 polnts) Al 2. Figure-1 below shows a DSB-SC modulator. The carrier avaliable at the multiplier is a distorted sinusoid given by c(t)- Cos3(wet). The spectrum of m(t) is shown in Figure-2 M(f) m(t) Fllter -В c(t) Figure-2 Figure 1 a. Determine the signals and sketch their spectra at points b and c. (5 points). b. What kind of filter is required in Figure-1? Verify your answer. (5 points). c....
 1. Given a baseband signal m(t) sin(1000mt) cos(3000nt) + cos(3700nt a. Sketch the spectrum of m(t) (Hint. sin(a) cos(b) 0.5 sin(a +b) +0.5sin a-b)) b. Sketch the spectrum of DSB-CS signal m(t)cos(10000mt) C ldentify the upper sideband {USB) and lower sideband (LSB) spectra d. Give the black diagram of the receiver to receive DSB-CS signal in (b). 2. baseband signal m(r)--0.5 + Σ..小(t-n)-u(t-0.5-n)] where ult) is the Given unit step function, an amplitude modulated signal is as SAM 107+ m(0cos...
 4.4-6 An LSB signal is demodulated coherently, as shown in Fig. P4.4-6. Unfortunately, because of the transmission delay, the received signal carrier is not 2 cos Wet as sent, but rather, is 2 cos[wc + Aw)t + 8). The local oscillator is still cos wct. Show the following. (a) When 8 = 0, the output y(t) is the signal m(t) with all its spectral components shifted (offset) by Ao. Hint: Observe that the output y(t) is identical to the right-hand...
 When the message signal m (t) =cos (2π fmt) and the
carrier signal is c(t)=cos (2π fct) ,
fm<< fc,
The modulated DSB-SC signal
SDSB-SC=m(t)cos(2πfct) is generated, and only
the upper sideband
To generate and transmit the SSB signal. As shown in the figure
below, the receiver is a local oscillator
cosine signal to the received signal and passes it through a
low-pass filter. Answer the following questions.
(a) Draw the waveform of DSB-SC modulated signal
SDSB-SC(t)
(b)Find the result...
When the message signal m (t) =cos (2π fmt) and the
carrier signal is c(t)=cos (2π fct) ,
fm<< fc,
The modulated DSB-SC signal
SDSB-SC=m(t)cos(2πfct) is generated, and only
the upper sideband
To generate and transmit the SSB signal. As shown in the figure
below, the receiver is a local oscillator
cosine signal to the received signal and passes it through a
low-pass filter. Answer the following questions.
(a) Draw the waveform of DSB-SC modulated signal
SDSB-SC(t)
(b)Find the result...
 signals and communications 2
Make sure you show all working and describe each step in your calculations. 1. A signum function is defined as sgn(t) = { 1、12 0 1 t<0 Plot and express this function in terms of the unit-step function. 5 marks/ Determine and plot the even and odd parts of the signal 2. x(t) (te-3 +2)u(t). 5 marks 3. If prove that y[n-m] = x[n-m] * h[n]. 5 marks 4. Assuming α > 0, plot the signal...
signals and communications 2
Make sure you show all working and describe each step in your calculations. 1. A signum function is defined as sgn(t) = { 1、12 0 1 t<0 Plot and express this function in terms of the unit-step function. 5 marks/ Determine and plot the even and odd parts of the signal 2. x(t) (te-3 +2)u(t). 5 marks 3. If prove that y[n-m] = x[n-m] * h[n]. 5 marks 4. Assuming α > 0, plot the signal...
 Analysis Linear Systems
Problem 17. Consider the standard amplitude-modulation system shown in Figure 3 Figure 3 x) Channel Filter he(r) cos wor cos ωοι M(w) H(u) (a) Sketch the spectrum of r(t). (b) Sketch the spectrum of y(t) for the following cases: (i) 0S WcWo-m (iii) wc >wowm (c) Sketch the spectrum of z(t) for the following cases: (i) 0 S WcWo-m (iii) wc >wowm d) Sketch the spectrum of v(t) if we wowm and (i) w
Analysis Linear Systems
Problem 17. Consider the standard amplitude-modulation system shown in Figure 3 Figure 3 x) Channel Filter he(r) cos wor cos ωοι M(w) H(u) (a) Sketch the spectrum of r(t). (b) Sketch the spectrum of y(t) for the following cases: (i) 0S WcWo-m (iii) wc >wowm (c) Sketch the spectrum of z(t) for the following cases: (i) 0 S WcWo-m (iii) wc >wowm d) Sketch the spectrum of v(t) if we wowm and (i) w
 can you please solve this problem step by step, thank
you!!
1. Consider a DSB-SC signal with noise passes through a demodulator shown below. ViC0) 2(0) но но 0) The input signal plus noise is v,(t)-5,() + n'(t) where 5,0): Am(1)cos2r/rt, m(1) cos 2π/J is the message signal with f-</м , carrier frequency is f> fe , and noise n' (r) has power spectral density function G,じ)= η . The local carrier is v,(1)s 2 cosZrw. The carrier filter is...
can you please solve this problem step by step, thank
you!!
1. Consider a DSB-SC signal with noise passes through a demodulator shown below. ViC0) 2(0) но но 0) The input signal plus noise is v,(t)-5,() + n'(t) where 5,0): Am(1)cos2r/rt, m(1) cos 2π/J is the message signal with f-</м , carrier frequency is f> fe , and noise n' (r) has power spectral density function G,じ)= η . The local carrier is v,(1)s 2 cosZrw. The carrier filter is...
 This is taken from Section 4.6, "Amplitude Modulation and the
Continuous-Time Fourier Transform," in the course text Computer
Explorations in signals and systems by Buck, Daniel, Singer, 2nd
Edition. I need the answers for the basic and intermediate
questions.
4.6 Amplitude Modulation and the Continuous-Time Fouriei Transform This exercise will explore amplitude modulation of Morse code messages. A simple ampli tude modulation system can be described by x(t) = m(t) cos(Crfot), (4.13) where m(t) is called the message waveform and...
This is taken from Section 4.6, "Amplitude Modulation and the
Continuous-Time Fourier Transform," in the course text Computer
Explorations in signals and systems by Buck, Daniel, Singer, 2nd
Edition. I need the answers for the basic and intermediate
questions.
4.6 Amplitude Modulation and the Continuous-Time Fouriei Transform This exercise will explore amplitude modulation of Morse code messages. A simple ampli tude modulation system can be described by x(t) = m(t) cos(Crfot), (4.13) where m(t) is called the message waveform and...
 can someone help me do this and maybe also the picture of the
scope explain how you get it. thankyou!
Frequency-shift keying (FSK) and Phase-shift keying (PSK) Two other modulation schemes are the phase-shift keying (PSK) and the frequency-shift keying (FSK). These are illustrated in Figure 8 b and c respectively. In phase-shift keying the carrier signal changes phase by a radians when the digital signal changes values. In frequency-shift keying a 0 is transmitted at a different carrier frequency...
can someone help me do this and maybe also the picture of the
scope explain how you get it. thankyou!
Frequency-shift keying (FSK) and Phase-shift keying (PSK) Two other modulation schemes are the phase-shift keying (PSK) and the frequency-shift keying (FSK). These are illustrated in Figure 8 b and c respectively. In phase-shift keying the carrier signal changes phase by a radians when the digital signal changes values. In frequency-shift keying a 0 is transmitted at a different carrier frequency...
Most questions answered within 3 hours.
-
In C++
In this homework, you will be tasked with creating functions to
manipulate strings that...
asked 11 minutes ago -
An isolated colony represents a pure culture. one rare occasions
, however , a colony can...
asked 25 minutes ago -
*****DO NOT ANSWER THIS QUESTION IF YOU DON'T
KNOW*******Rights and Duties of Auditors; Minimum 4000
words...
asked 1 hour ago -
The probability that Janie is wearing sunglasses is 1/4. The
probability that she is wearing sunglasses...
asked 1 hour ago -
Do you believe social media is more of a help or a hindrance in
controlling crises...
asked 2 hours ago -
Two long, parallel wires separated by 2.85 cm carry currents in
opposite directions. The current in...
asked 1 hour ago -
Question # 1. Develop a list of rehabilitation journals
that publish articles concerning career counseling for...
asked 1 hour ago -
Bryant Company has a factory machine with a book value of
$85,100 and a remaining useful...
asked 2 hours ago -
What is the default classification for federal tax purposes of a
U.S. eligible entity with one...
asked 2 hours ago -
1. How many grams would 4.0x10²¹ atoms of calcium
weigh?
2.. Calculate the percent oxygen in...
asked 2 hours ago -
Balance Equation
K2Cr2O7 + H2C2O4 2H2O 6 K[Cr(C2O4 )2 (H2O)2 ]2H2O + CO2 +
H2O
asked 2 hours ago -
Select a position in the clinical laboratory and write an
appropriate job description and corresponding work...
asked 2 hours ago