Problems deal further with the car of Example. Its upward displacement function satisfies...
Problems deal further with the car of Example. Its upward displacement function satisfies the equation mx″ + cx? + kx = cy′ + ky when the shock absorber is connected (so that c > 0) With y = a sin ωt for the road surface, this differential equation becomesmx″ + cx′ +kx = E0 cosωt + F0 sin ωtwhere E0 = cωa and F0 = ka.
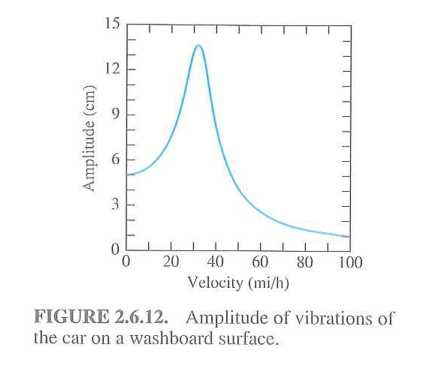
Figure shows the graph of the amplitude function C(ω) using the numerical data given in Example(including c = 3000 N.s/m). It indicates that, as the car accelerates gradually from rest, it initially oscillates with amplitude slightly over 5 cm. Maximum resonance vibrations with amplitude about 14 cm occur around 32 mi/h, but then subside to more tolerable levels at high speeds. Verify these graphically based conclusions by analyzing the function C(ω). In particular, find the practical resonance frequency and the corresponding amplitude
Step-by-Step Solution
Request Professional Solution
Request Solution!
We need at least 10 more requests to produce the solution.
0 / 10 have requested this problem solution
The more requests, the faster the answer.
All students who have requested the solution will be notified once they are available.
Add your Solution
Textbook Solutions and Answers Search
ADVERTISEMENT
Need Online Homework Help?
Ask
a QuestionGet Answers For Free
Most questions answered within 3 hours.
Most questions answered within 3 hours.
ADVERTISEMENT
Recent Solutions
-
Calculating the space time for parallel reactions. m-Xylene is reacted over a ZSM-5 zeolit...
-
Determine Vo and ID for the networks of Fig. 2.160.FIG. 2.160
-
The truck travels along a circular road that has a radius of 50 m at a speed of 4 m/s. F...
-
A state legislature enacted a statute that required any motorcycle operator or passenger...
-
A 1024 × 1024 8-bit image with 5.3 bits/pixel entropy [computed from its histogram using E...
-
In Problem 3.3, we estimated the equationwhere we now report standard errors along with th...
-
In each of the following cases, deduce the nature of the light that is consistent with the...
-
Solve Example 20.5 such that the x, y, z axes move with curvilinear translation, Ω = 0 in...
-
In Fig. 6.43, if i = cos 4t and v = sin 4t, the element is:(a)a resistor(b) a capacitor(c)...
-
Sketch vo for each network of Fig. 2.181 for the input shown.FIG. 2.181
-
(Supplement B) Computing and Reporting Cash Flow Effectsof Sale of Plant and EquipmentDuri...
-
A 350-mL spherical flask contains 0.075 mol of an ideal gas at a temperature of 293 K. Wha...