Use the green rectangle (triangle symbols) to compute total revenue at various prices along the demand...
Use the green rectangle (triangle symbols) to compute total revenue at various prices along the demand curve. Note: You will not be graded on any changes made to this graph.

On the following graph, use the green point (triangle symbol) to plot the annual total revenue when the market price is $50, $75, $100, $125, $150, $175, and $200 per bike.

According to the midpoint method, the price elasticity of demand between points A and B is approximately _______
Suppose the price of bikes is currently $125 per bike, shown as point A on the initial graph. Because the demand between points A and B is _______ , a $25-per-bike decrease in price will lead to _______ in total revenue per day.
In general, in order for a price increase to cause an increase in total revenue, demand must be _______
Homework Answers
| price | quantity | total revenue |
| $50 | 30 | 1500 |
| $75 | 27 | 2025 |
| $100 | 24 | 2400 |
| $125 | 21 | 2625 |
| $150 | 18 | 2700 |
| $175 | 15 | 2625 |
| $200 | 12 | 2400 |
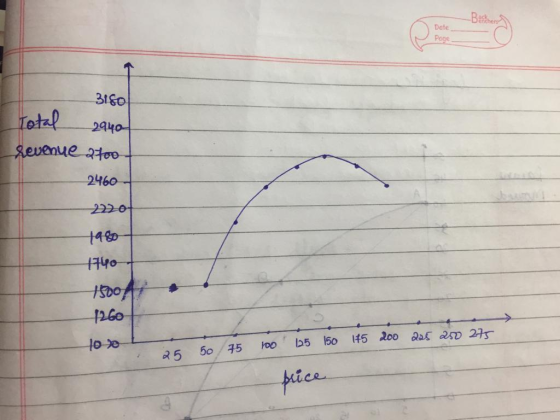
The total revenue curve is initially upward sloping till price = $150 and falls when price increases more than $150.
A(21 , 125)= (q1, P1)
b ( 24,100)= (q2 , p2)
price elasticity = (q2- q1)*([p1+ p2)/2] / (p2 - p1)*[( q2 + q1)/2 ]
q2- q1 = 24- 21 = 3
(q2 + q1)/ 2 = (24 + 21)/2 = 22.5
p2- p1 = 100 - 125 = -25
(P2+ p1 )/2 = 100 +125 /2 = 112.5
putting the values in question
elasticity = 3*112.5/ 25*22.5
= 337.5/562.5
= 0.6
price elasticity between points And B is 0.6 .Suppose the price of bike = $125 . Because the demand for bikes between A and B is inelastic , a $25 per bike decrease in price will lead to DECREASE in total revenue .
in general , in order. for price increase to cause an increase in total revenue , demand must be inelastic
Add Answer to:
Use the green rectangle (triangle symbols) to compute total revenue at various prices along the demand...
Use the green rectangle (triangle symbols) to compute total revenue at various prices along the demand curve.
 Use the green rectangle (triangle symbols) to compute total revenue at various prices along the demand curve. Note: You will not be graded on any changes made to this graph. On the following graph, use the green point (triangle symbol) to plot the annual total revenue when the market price is $50, $75, $100, $125, $150, $175, and $200 per bike. According to the midpoint method, the price elasticity of demand between points A and B is approximately _______ .Suppose the price of...
Use the green rectangle (triangle symbols) to compute total revenue at various prices along the demand curve.
 Use the green rectangle (triangle symbols) to compute total revenue at various prices along the demand curve. Note: You will not be graded on any changes made to this graph. On the following graph, use the green point (triangle symbol) to plot the annual total revenue when the market price is $40, $60, $80, $100, $120, $140, and $160 per bike. According to the midpoint method, the price elasticity of demand between points A and B is approximately _______ . Suppose the...
5. Elasticity and total revenue The following graph shows the daily demand curve for bikes in Miami. Use the green rectangle (triangle symbols) to compute total revenue at various prices along the demand curve. Note: You will not be graded on any changes
 5. Elasticity and total revenueThe following graph shows the daily demand curve for bikes in Miami.Use the green rectangle (triangle symbols) to compute total revenue at various prices along the demand curve.Note: You will not be graded on any changes made to this graph.On the following graph, use the green point (triangle symbol) to plot the annual total revenue when the market price is $50, $75, $100, $125, $150, $175, and $200 per bike. According to the midpoint method, the price...
Can someone tell me if this is right? Use the green rectangle (triangle symbols) to compute...
 Can someone tell me if this is right?
Use the green rectangle (triangle symbols) to compute total revenue at various prices along the demand curve. Note: You will not be graded on any changes made to this graph. Total Revenue PRICE (Dollars per bike) Demand 0 4 8 12 36 40 44 48 16 20 24 28 32 QUANTITY (Bikes) On the following graph, use the green point (triangle symbol) to plot the annual total revenue when the market price...
Can someone tell me if this is right?
Use the green rectangle (triangle symbols) to compute total revenue at various prices along the demand curve. Note: You will not be graded on any changes made to this graph. Total Revenue PRICE (Dollars per bike) Demand 0 4 8 12 36 40 44 48 16 20 24 28 32 QUANTITY (Bikes) On the following graph, use the green point (triangle symbol) to plot the annual total revenue when the market price...
6. Elasticity and total revenue The following graph shows the daily demand curve for bikes in...
 6. Elasticity and total revenueThe following graph shows the daily demand curve for bikes in Dallas.Use the green rectangle (triangle symbols) to compute total revenue at various prices along the demand curve.Note: You will not be graded on any changes made to this graph.On the following graph, use the green point (triangle symbol) to plot the annual total revenue when the market price is $ 50, $ 75, $ 100, $ 125, $ 150, $ 175, and $ 200 per...
6. Elasticity and total revenue The following graph shows the daily demand curve for bikes in...
 6. Elasticity and total revenue The following graph shows the daily demand curve for bikes in Denver Use the green rectangle (triangle symbols) to compute total revenue at various prices along the demand cur Note: You will not be graded on any changes made to this graph.On the following graph, use the green point (triangle symbol) to plot the annual total revenue when the market price is $50, $75, $100, $125, $150, $175, and $200 per bike. According to the midpoint method, the price...
On the following graph, use the green point (triangle symbol) to plot the annual total revenue when the market price is $30, $45, $60, $75, $90, $105, and $120 per bike.
 6. Elasticity and total revenue The following graph shows the daily demand curve for bikes in Houston. Use the green rectangle (triangle symbols) to compute total revenue at various prices along the demand curve. Note: You will not be graded on any changes made to this graph. On the following graph, use the green point (triangle symbol) to plot the annual total revenue when the market price is $30, $45, $60, $75, $90, $105, and $120 per bike. According to the midpoint method, the...
The following graph shows the daily demand curve for bikes in San Francisco.
 6. Elasticity and total revenueThe following graph shows the daily demand curve for bikes in San Francisco.Use the green rectangle (triangle symbols) to compute total revenue at various prices along the demand curve.Note: You will not be graded on any changes made to this graph.On the following graph, use the green point (triangle symbol) to plot the annual total revenue when the market price is $ 50,575, $ 100, $ 125, $ 150, $ 175, and $ 200 per bike.According...
On the following graph, use the green point (triangle symbol) to plot the annual total revenue...
 On the following graph, use the green point (triangle symbol) to plot the annual total revenue when the market price is $50, $75, $100, $125, $150, $175, and $200 per bike. According to the midpoint method, the price elasticity of demand between points A and B is approximately _______ . Suppose the price of bikes is currently $200 per bike, shown as point A on the initial graph. Because the demand between points A and B is _______ ,a $25-per-bike decrease in...
The following graph shows the daily demand curve for bikes in Detroit.
 6. Elasticity and total revenue The following graph shows the daily demand curve for bikes in Detroit. Use the green rectangle (triangle symbols) to compute total revenue at various prices along the demand curve. Note: You will not be graded on any changes made to this graph. On the following graph, use the green point (triangle symbol) to plot the annual total revenue when the market price is $50, $75, $100, $125, $150, $175, and $200 per bike. According to the midpoint method, the price...
 Can someone tell me if this is right?
Use the green rectangle (triangle symbols) to compute total revenue at various prices along the demand curve. Note: You will not be graded on any changes made to this graph. Total Revenue PRICE (Dollars per bike) Demand 0 4 8 12 36 40 44 48 16 20 24 28 32 QUANTITY (Bikes) On the following graph, use the green point (triangle symbol) to plot the annual total revenue when the market price...
Can someone tell me if this is right?
Use the green rectangle (triangle symbols) to compute total revenue at various prices along the demand curve. Note: You will not be graded on any changes made to this graph. Total Revenue PRICE (Dollars per bike) Demand 0 4 8 12 36 40 44 48 16 20 24 28 32 QUANTITY (Bikes) On the following graph, use the green point (triangle symbol) to plot the annual total revenue when the market price...
 6. Elasticity and total revenue The following graph shows the daily demand curve for bikes in Denver Use the green rectangle (triangle symbols) to compute total revenue at various prices along the demand cur Note: You will not be graded on any changes made to this graph.On the following graph, use the green point (triangle symbol) to plot the annual total revenue when the market price is $50, $75, $100, $125, $150, $175, and $200 per bike. According to the midpoint method, the price...
Most questions answered within 3 hours.
-
The activation energy for a given reaction is 50.3 kJ/mol. If
the rate constant for the...
asked 22 minutes ago -
An entomologist discovers a dung beetle rolling a ball of dung
along the ground, and decides...
asked 2 hours ago -
Humans have used horses for transportation for millions of
years. Therefore, they will use horses for...
asked 4 hours ago -
The following are the Jensen Corporation's unit costs of making
and selling an item at a...
asked 4 hours ago -
Does direct Medicare reimbursement of Advanced practice nurses
increase access to their services?
asked 5 hours ago -
List and explain why a company would choose to use a
published
compensation survey vs. creating...
asked 5 hours ago -
A discrete random variable X can take values from 1 to 10. Find
the variance of...
asked 5 hours ago -
The primary financial goal of a corporation is to maximize:
shareholders wealth.
earnings per share.
stock...
asked 5 hours ago -
determine whether the vectors u=(1,2,3,), v=(-2,1,0) and
w=(1,0,1) are linearly dependent or independent.
asked 5 hours ago -
python
Define a function called print_values which takes a dictionary
object as a parameter. The function...
asked 6 hours ago -
In Chapter 1 you created a program named Triangle in
which you displayed a seven-line triangle...
asked 6 hours ago -
Research question: What are the differences between separately
stated and non separately stated transactions in an...
asked 7 hours ago