
Homework Answers
Following problem is based on stem plot of pulse rate of men and
women and we compare the stemplotas well:-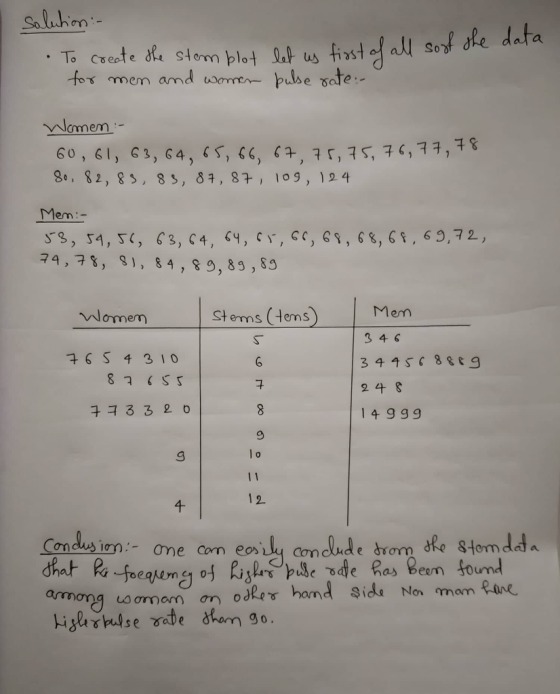
Add Answer to:
15. A format for back to school stemplots representing the
pulse rate of females and males...
A format for back-to-back stemplots representing the pulse rate of females and males from the given...
 A format for back-to-back stemplots representing the pulse rate of females and males from the given data is shown below. Complete the back-to-back stemplot, then compare the results Females 76 82 77 82 64 84 61 83 69 64 68 72 75 107 64 79 83 61 86 122 Males Full data set 65 83 68 60 72 82 50 64 82 82 79 60 67 60 53 72 81 64 51 68 Women Stem (tens) Men 013 9844411 7...
Use the accompanying data set on the pulse rates (in beats per minute) of males to...
Use the accompanying data set on the pulse rates (in beats per minute) of males to complete parts (a) and (b) below. LOADING... Click the icon to view the pulse rates of males. a. Find the mean and standard deviation, and verify that the pulse rates have a distribution that is roughly normal. The mean of the pulse rates is 71.871.8 beats per minute. (Round to one decimal place as needed.) The standard deviation of the pulse rates is 12.212.2...
Listed below are pulse rates (beats per minute) from samples of adult males and females. Find...
 Listed below are pulse rates (beats per minute) from samples of adult males and females. Find the mean and median for each of the two samples and then compare the two sets of results. Does there appear to be a difference? Male: 67 54 54 86 77 55 62 61 64 57 59 88 63 76 69 Female: 90 79 87 88 68 63 93 87 87 84 66 89 72 89 74 Find the means. The mean for males...
Use the same scales to construct boxplots for the pulse rates of males and females from...
 Use the same scales to construct boxplots for the pulse rates of males and females from the accompanying data sets. Use the boxplots to compare the two data sets m Click the icon to view the data sets - X Determine the boxplot for the men's pulse rate data Pulse rates for men and wome А B. e Men's Pulse Rates 58 72 72 60 60 86 36 75 77 76 Full data set Storio 50 60 70 80 90...
Listed below are pulse rates (beats per minute) from samples of adult males and females. Does there appear to be a difference? Find the coefficient of variation for each of the two samples; then c...
Listed below are pulse rates (beats per minute) from samples of adult males and females. Does there appear to be a difference? Find the coefficient of variation for each of the two samples; then compare the variation. Male 89 70 63 70 71 50 62 53 83 69 62 64 98 56 66 Female 67 82 79 72 72 82 86 85 89 87 93 70 90 80 80
isted below are pulse rates (beats per minute) from samples of adult males and females. Find...
isted below are pulse rates (beats per minute) from samples of adult males and females. Find the mean and median for each of the two samples and then compare the two sets of results. Does there appear to be a difference? Male: 68 59 55 95 72 73 57 88 56 69 57 54 62 55 85 Female: 66 72 87 89 73 68 88 84 95 89 87 91 76 62 88
Listed below are pulse rates? (beats per? minute) from samples of adult males and females. Does...
Listed below are pulse rates? (beats per? minute) from samples of adult males and females. Does there appear to be a? difference? Find the coefficient of variation for each of the two? samples; then compare the variation. Male 90 71 64 72 72 53 65 52 84 69 64 60 96 54 62 Female 64 83 79 70 74 84 87 85 89 89 92 69 88 80 80 The coefficient of variation for the male pulse is ____ %...
Listed below are pulse rates (beats per minute) from samples of adult males and females. Does...
 Listed below are pulse rates (beats per minute) from samples of adult males and females. Does there appear to be a difference? Find the coefficient of variation for each of the two samples; ther compare the variation. Male 90 72 60 70 71 53 62 52 82 70 63 64 98 58 65 Female 65 84 81 69 73 83 89 87 88 89 92 71 90 79 79 The coefficient of variation for the male pulse rates is 1...
on ма m Question Help Refer to the accompanying data set and construct a 90% confidence...
 on ма m Question Help Refer to the accompanying data set and construct a 90% confidence interval estimate of the mean pulse rate of adult females; then do the same for adult males. Compare the results. Click the icon to view the pulse rates for adult females and adult males Construct a 90% confidence interval of the mean pulse rate for adult females. bpmu<bpm (Round to one decimal place as needed.) Construct a 90% confidence interval of the mean pulse...
 A format for back-to-back stemplots representing the pulse rate of females and males from the given data is shown below. Complete the back-to-back stemplot, then compare the results Females 76 82 77 82 64 84 61 83 69 64 68 72 75 107 64 79 83 61 86 122 Males Full data set 65 83 68 60 72 82 50 64 82 82 79 60 67 60 53 72 81 64 51 68 Women Stem (tens) Men 013 9844411 7...
 Listed below are pulse rates (beats per minute) from samples of adult males and females. Find the mean and median for each of the two samples and then compare the two sets of results. Does there appear to be a difference? Male: 67 54 54 86 77 55 62 61 64 57 59 88 63 76 69 Female: 90 79 87 88 68 63 93 87 87 84 66 89 72 89 74 Find the means. The mean for males...
 Listed below are pulse rates (beats per minute) from samples of adult males and females. Find the mean and median for each of the two samples and then compare the two sets of results. Does there appear to be a difference? Male: 67 54 54 86 77 55 62 61 64 57 59 88 63 76 69 Female: 90 79 87 88 68 63 93 87 87 84 66 89 72 89 74 Find the means. The mean for males...
 Use the same scales to construct boxplots for the pulse rates of males and females from the accompanying data sets. Use the boxplots to compare the two data sets m Click the icon to view the data sets - X Determine the boxplot for the men's pulse rate data Pulse rates for men and wome А B. e Men's Pulse Rates 58 72 72 60 60 86 36 75 77 76 Full data set Storio 50 60 70 80 90...
 Listed below are pulse rates (beats per minute) from samples of adult males and females. Does there appear to be a difference? Find the coefficient of variation for each of the two samples; ther compare the variation. Male 90 72 60 70 71 53 62 52 82 70 63 64 98 58 65 Female 65 84 81 69 73 83 89 87 88 89 92 71 90 79 79 The coefficient of variation for the male pulse rates is 1...
 on ма m Question Help Refer to the accompanying data set and construct a 90% confidence interval estimate of the mean pulse rate of adult females; then do the same for adult males. Compare the results. Click the icon to view the pulse rates for adult females and adult males Construct a 90% confidence interval of the mean pulse rate for adult females. bpmu<bpm (Round to one decimal place as needed.) Construct a 90% confidence interval of the mean pulse...
Most questions answered within 3 hours.
-
use
hardy wineberg equation to find equilbrium.
AA 150. Aa 120. aa 90
asked 4 minutes ago -
Two children (m = 31.0 kg each) stand opposite each other on the
edge of a...
asked 5 minutes ago -
A 2180-kg car is slowed down uniformly from 24.6 m/s to 5.2 m/s
in 3.32 s....
asked 31 minutes ago -
Jesse’s Machining is looking to buy a new machine to handle a
new four-year contract for...
asked 37 minutes ago -
5. A slide mount of a fungal specimen is prepared. A slide and
coverslip are flame-sterilized....
asked 39 minutes ago -
A parallel plate capacitor has a charge Q, plates of area A and
separation d, where...
asked 42 minutes ago -
This question goes along with my test results for a psychology
seminar. The results were the...
asked 42 minutes ago -
A calorimeter contains 35.0 mL of water at 13.0 ∘C . When 1.40 g
of X...
asked 47 minutes ago -
[The following information applies to the questions
displayed below.]
Arndt, Inc. reported the following for 2021...
asked 48 minutes ago -
Equivalent Units of Conversion Costs
The Rolling Department of Kraus Steel Company had 2,370 tons in...
asked 54 minutes ago -
Genetic differences between closely related species are due to
changes at both synonymous and nonsynonymous sites...
asked 1 hour ago -
Assignment:
Implement an 8 bit register in VHDL/Verilog using Model Sim
software. Show two test cases...
asked 1 hour ago