

Homework Answers

Add Answer to:
18. The following data were obtained from an inde- pendent-measures study comparing three treatment conditions. Treatment...
The data below are from an independent-measures experiment comparing three different treatment conditions. Treatment 1 Treatment...
The data below are from an independent-measures experiment comparing three different treatment conditions. Treatment 1 Treatment 2 Treatment 3 0 1 4 0 4 3 G=24 0 1 6 SX squared=92 2 0 3 _________________________________ T=2 T=6 T=16 SS=3 SS=9 SS=6 Use an ANOVA with a=.05 to determine whether these data indicate any significant differences among treatments. Use the Tukey’s HSD to determine which of the treatments are significantly different from each other at the .05 level....
1. The following data represent the results from an independent-measures experiment comparing three treatment conditions. Use an analysis...
1. The following data represent the results from an independent-measures experiment comparing three treatment conditions. Use an analysis of variance with α = .05 to determine whether these data are sufficient to conclude that there are significant differences between the treatments. You do not need to do post-hoc tests. Treatments 1 2 3 2 6 6 N = 12 4 6 10 G = 60 2 2 10 ∑X2 = 408 0 6 6 T = 8 T = 20 T = 32 SS = 8 SS = 12 SS = 16 2. A researcher reports an F-ratio with df =...
The following data represent the results from an independent-measures experiment comparing three treatment conditions. Use an...
The following data represent the results from an independent-measures experiment comparing three treatment conditions. Use an analysis of variance with α = .05 to determine whether these data are sufficient to conclude that there are significant differences between the treatments (Hint: start by filling in the missing values on the table below). Be sure to show all formulas with symbols (and plug in numbers), steps, processes and calculations for all steps and all parts of all answers. Treatment 1 Treatment...
The following data represent the results from an independent-measures study comparing three treatments. Treatment I II...
The following data represent the results from an independent-measures study comparing three treatments. Treatment I II III n = 13 n = 13 n = 13 M = 3 M = 3 M = 7 T = 39 T = 39 T = 91 (a) Compute SS for the set of 3 treatment means. (Use the three means as a set of n = 3 scores and compute SS.) (Use 1 decimal place.) (b) Using the result from part (a),...
The data below are from an independent-measures experiment comparing three different treatment conditions. Conduct a one-way...
The data below are from an independent-measures experiment comparing three different treatment conditions. Conduct a one-way ANOVA on the data. Use ANOVA Handout from the One-Way ANOVA module to guide your calculations. Tell help your error checking, I will tell you that SSTotal = 74 and dfTotal = 11. Treatment 1 Treatment 2 Treatment 3 0 1 6 1 4 5 0 1 8 3 2 5 ***1.Compute SSBetween ( I am stuck on this one) 2.ss within =18 3.df...
The following data represent the results from an independent-measures study comparing two treatment conditions. Treatment Treatment...
 The following data represent the results from an independent-measures study comparing two treatment conditions. Treatment Treatment One Two 2.5 7.2 5.2 7.6 5.8 4.4 6.3 4.5 4.7 5.2 4.8 3 Using technology, run the One-way ANOVA Test for this data: F-ratio: p-value: Now, run the Two Independent Sample t test on the same data: Note: Do this with "pooled variances" since one assumption we make with ANOVA is that the variances for each group are equal. t-statistic: p-value: Do you...
The following data represent the results from an independent-measures study comparing two treatment conditions. Treatment One...
The following data represent the results from an independent-measures study comparing two treatment conditions. Treatment One Treatment Two 7.4 5.4 5.4 2.4 7.5 4.7 6.3 5.9 6.6 5.3 8.7 3.7 6.8 2.3 Run the single-factor ANOVA for this data: F-ratio: p-value: Now, run the t test on the same data: t-statistic: p-value: Consider how these are the same or different.
I The following data were obtained from a study comparing 3 treatment conditions, with 5 participants...
 I The following data were obtained from a study comparing 3 treatment conditions, with 5 participants in each treatment condition. Assuming the statistic reported below is significant at .05 conduct Tukey post hoc tests for all pairwise comparisons. Treatment 1 Treatment 2 Treatment 3 Means MS SS 70 F=10.51 Source Between Treatments Within Treatments Total 3.33 110 :
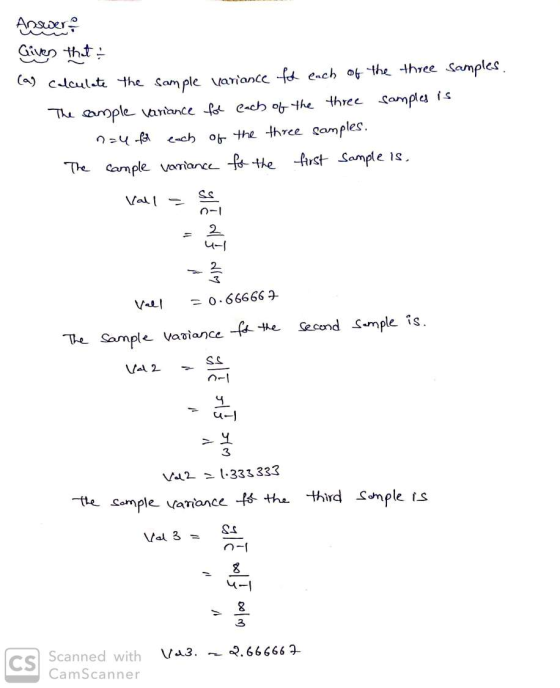
5. The following data were obtained in a study using three separate samples to compare three...
 5. The following data were obtained in a study using three separate samples to compare three different treatments. (13 points total) Treatment 1 Treatment 2 Treatment 3 mm M =4 SS = 2 M = 2 SS = 4 M = 6 SS = 8 a. Fill in the ANOVA table below. (4 points) SS df MSF Source Between treatments Within treatments Total b. If a = .05 and the Fcritical value = 4.26., what decision would you make? (1...
The following data represent the results from an independent-measures experiment comparing three treatment conditions. Use StatCrunch...
 The following data represent the results from an independent-measures experiment comparing three treatment conditions. Use StatCrunch to conduct an analysis of variance with a = 0.05 to determine whether these data are sufficient to conclude that there are significant differences between the treatments. Treatment A Treatment B Treatment C 5 5 12 3 6 6 5 4 10 4 7 9 3 3 8 F-ratio = p-value = Conclusion: There is a significant difference between treatments These data do not...
 The following data represent the results from an independent-measures study comparing two treatment conditions. Treatment Treatment One Two 2.5 7.2 5.2 7.6 5.8 4.4 6.3 4.5 4.7 5.2 4.8 3 Using technology, run the One-way ANOVA Test for this data: F-ratio: p-value: Now, run the Two Independent Sample t test on the same data: Note: Do this with "pooled variances" since one assumption we make with ANOVA is that the variances for each group are equal. t-statistic: p-value: Do you...
 I The following data were obtained from a study comparing 3 treatment conditions, with 5 participants in each treatment condition. Assuming the statistic reported below is significant at .05 conduct Tukey post hoc tests for all pairwise comparisons. Treatment 1 Treatment 2 Treatment 3 Means MS SS 70 F=10.51 Source Between Treatments Within Treatments Total 3.33 110 :
 5. The following data were obtained in a study using three separate samples to compare three different treatments. (13 points total) Treatment 1 Treatment 2 Treatment 3 mm M =4 SS = 2 M = 2 SS = 4 M = 6 SS = 8 a. Fill in the ANOVA table below. (4 points) SS df MSF Source Between treatments Within treatments Total b. If a = .05 and the Fcritical value = 4.26., what decision would you make? (1...
 The following data represent the results from an independent-measures experiment comparing three treatment conditions. Use StatCrunch to conduct an analysis of variance with a = 0.05 to determine whether these data are sufficient to conclude that there are significant differences between the treatments. Treatment A Treatment B Treatment C 5 5 12 3 6 6 5 4 10 4 7 9 3 3 8 F-ratio = p-value = Conclusion: There is a significant difference between treatments These data do not...
Most questions answered within 3 hours.
-
Arthur Meiners is the production manager of Wheel-Rite, a small
producer of metal parts. Wheel-Rite supplies...
asked 11 minutes ago -
Company Risk Premium A company has a beta of
4.57. If the market return is expected...
asked 9 minutes ago -
3. Which statement about nuclear fission is correct? (1
point)
A. Nuclear fission provides energy for...
asked 15 minutes ago -
If a $2,000 increase in income leads to a $1,5000 increase in
consumption expenditures, then the...
asked 15 minutes ago -
May you please put this in layman's terms?
ABSTRACT
Coagulase-negative staphylococci (CoNS) and Staphylococcus
aureus are...
asked 19 minutes ago -
If authentic leadership is really a lifelong process,
can teenagers be authentic leaders? Why or why...
asked 35 minutes ago -
Six years of quarterly data of a seasonally adjusted series are
used to estimate a linear...
asked 54 minutes ago -
Which of the following is not an ecological model used
to foster behavior change?
PRECEDE-PROCEED Model...
asked 57 minutes ago -
On the Apollo 14 mission to the moon, astronaut Alan Shepard hit
a golf ball with...
asked 53 minutes ago -
What are John’s potential claims if he is terminated
this week?
John is a 54-year-old man...
asked 1 hour ago -
A (8.5) cm tall object is placed at a distance of (14.2) cm from
a convex...
asked 1 hour ago -
(2) For the following questions, consider a data set that
exhibits a normal distribution. Report the...
asked 1 hour ago