The probability distribution for the number of cards owned is given below: Number of cards: 0...
The probability distribution for the number of cards owned is given below:
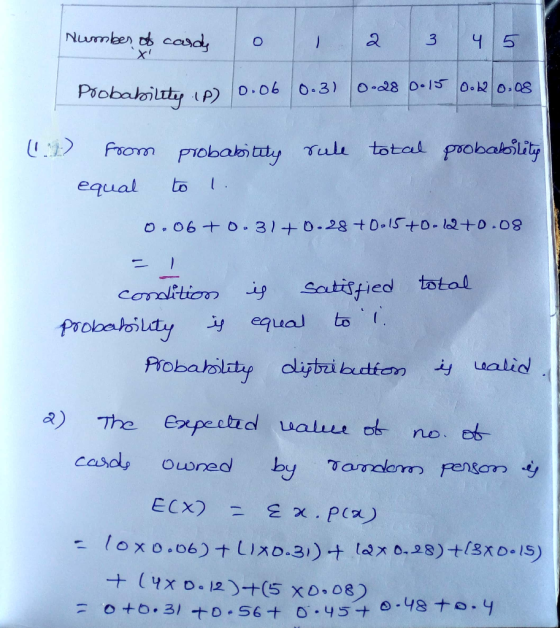
Number of cards: 0 1 2 3 4 5
Probability: 0.06 0.31 0.28 0.15 0.12 0.08
1) Show that above table is valid probability distribution
2)What is the expected value of number of cards owned by random person?
3)What is the probability that randomly selected person has less than 3 cards?
Homework Answers

Add Answer to:
The probability distribution for the number of cards owned is
given below:
Number of cards: 0...
Can you help me with the binomial probability distribution? Please see instructions in the two images....
 Can you help me with the binomial probability distribution?
Please see instructions in the two images. Thank you.
Binomial Probability Distribution 1. Explain in your own words the importance of studying the binomial probability distribution. 2. Next, the probability distribution of a random variable is presented x. 20 25 30 35 f(x) 0.38 0.10 0.15 0.37 a) What is presented in the table, is it a probability distribution? Explain. b) What is the probability that x = 35? c) What...
Can you help me with the binomial probability distribution?
Please see instructions in the two images. Thank you.
Binomial Probability Distribution 1. Explain in your own words the importance of studying the binomial probability distribution. 2. Next, the probability distribution of a random variable is presented x. 20 25 30 35 f(x) 0.38 0.10 0.15 0.37 a) What is presented in the table, is it a probability distribution? Explain. b) What is the probability that x = 35? c) What...
or a large population of people, the probability distribution for the random variable X = the...
or a large population of people, the probability distribution for the random variable X = the number of meals a person ate yesterday and the assigned probabilities is given below: Meals, X 1 2 3 4 5 Probability 0.19 0.35 0.26 0.15 ? a) Find P(X = 5), the probability that a randomly selected person ate 5 meals yesterday. P(X = 5) = (b) Find P(X 2), the probability that a randomly selected person ate 2 or fewer meals yesterday. P(X 2)...
Question 3 (1 point) Given the following probability distribution, what is the expected value? Outcome P(Outcome)...
Question 3 (1 point) Given the following probability distribution, what is the expected value? Outcome P(Outcome) 31 0.12 25 0.08 2 0.06 14 0.21 40 0.00 6 0.53 Round to 2 decimal places as needed.
Please explain and show all work 3· Le t x represent the number of credit cards...
 Please explain and show all work
3· Le t x represent the number of credit cards a student has. A random sample of 100 students at a large university was taken and the results are in the table below: Credit NumberRelative xStudentsPr) 12 P(x) Cards of Frequencyx .P(x) 45 25 10 TOTAL 100 1.00 a) Construct a probability distribution histogram and comment on its shape b) What is the probability a randomly selected student has at least two credit cards?...
Please explain and show all work
3· Le t x represent the number of credit cards a student has. A random sample of 100 students at a large university was taken and the results are in the table below: Credit NumberRelative xStudentsPr) 12 P(x) Cards of Frequencyx .P(x) 45 25 10 TOTAL 100 1.00 a) Construct a probability distribution histogram and comment on its shape b) What is the probability a randomly selected student has at least two credit cards?...
2. (25 P) A random number generator was used to generate a 100 numbers listed below....
 2. (25 P) A random number generator was used to generate a 100 numbers listed below. Perform x2 goodness of fit test to check whether the data distributed uniformly in the interval [0, 1] (a= 0.05, state the hypothesis first). 0.01 0.01 0.02 0.03 0.03 0.05 0.05 0.06 0.06 0.06 0.07 0.08 0.08 0.09 0.12 0.13 0.15 0.16 0.18 0.19 0.21 0.24 0.24 0.25 0.25 0.26 0.27 0.27 0.27 0.28 0.28 0.28 0.29 0.29 0.3 0.31 0.32 0.32 0.33 0.33...
Given the table below, what is the probability of a number greater than 2 and less...
Given the table below, what is the probability of a number greater than 2 and less than 5? Simple Event Probability 1 0.20 2 0.12 3 0.16 4 0.18 5 0.15 6 0.19
Use the probability distribution to complete parts (a) through (d) below. The probability distribution of number...
Use the probability distribution to complete parts (a) through (d) below. The probability distribution of number of televisions per household in a small town x 0 1 2 3 P(x) 0.03 0.13 0.31 0.53 (a) Find the probability of randomly selecting a household that has one or two televisions. The probability is nothing.
In problems 1 through 3, the table shows the approximate U.S. age distribution from the 2000...
In problems 1 through 3, the table shows the approximate U.S. age distribution from the 2000 Census. Use the table to determine the probability of the event. Age 19 and under 20-34 35-39 60-84 85 and over population 0.29 0.21 0.34 0.15 0.01 1. what is the probability that a randomly selected person in the United States will be at least 20 years old? ___________ 2. What is the probability that a randomly selected person in the United States will...
Use the probability distribution to complete parts (a) through (d) below. The probability distribution of number...
Use the probability distribution to complete parts (a) through (d) below. The probability distribution of number of televisions per household in a small town x 0 1 2 3 P(x) 0.02 0.19 0.28 0.51 (a) Find the probability of randomly selecting a household that has one or two televisions.
0 P(x) 0226 Given the above probability distribution for a random variableX of an experiment: 0328...
 0 P(x) 0226 Given the above probability distribution for a random variableX of an experiment: 0328 0215 0.106 Find the value of the unknownprobability p that makes the above table into a valid probability distribution. a. b. INrepresents the number of suecesses in the experiment, Dctermine the expected value of X c. Determine a value of p that makes it invalid and demonstrate why
 Can you help me with the binomial probability distribution?
Please see instructions in the two images. Thank you.
Binomial Probability Distribution 1. Explain in your own words the importance of studying the binomial probability distribution. 2. Next, the probability distribution of a random variable is presented x. 20 25 30 35 f(x) 0.38 0.10 0.15 0.37 a) What is presented in the table, is it a probability distribution? Explain. b) What is the probability that x = 35? c) What...
Can you help me with the binomial probability distribution?
Please see instructions in the two images. Thank you.
Binomial Probability Distribution 1. Explain in your own words the importance of studying the binomial probability distribution. 2. Next, the probability distribution of a random variable is presented x. 20 25 30 35 f(x) 0.38 0.10 0.15 0.37 a) What is presented in the table, is it a probability distribution? Explain. b) What is the probability that x = 35? c) What...
 Please explain and show all work
3· Le t x represent the number of credit cards a student has. A random sample of 100 students at a large university was taken and the results are in the table below: Credit NumberRelative xStudentsPr) 12 P(x) Cards of Frequencyx .P(x) 45 25 10 TOTAL 100 1.00 a) Construct a probability distribution histogram and comment on its shape b) What is the probability a randomly selected student has at least two credit cards?...
Please explain and show all work
3· Le t x represent the number of credit cards a student has. A random sample of 100 students at a large university was taken and the results are in the table below: Credit NumberRelative xStudentsPr) 12 P(x) Cards of Frequencyx .P(x) 45 25 10 TOTAL 100 1.00 a) Construct a probability distribution histogram and comment on its shape b) What is the probability a randomly selected student has at least two credit cards?...
 2. (25 P) A random number generator was used to generate a 100 numbers listed below. Perform x2 goodness of fit test to check whether the data distributed uniformly in the interval [0, 1] (a= 0.05, state the hypothesis first). 0.01 0.01 0.02 0.03 0.03 0.05 0.05 0.06 0.06 0.06 0.07 0.08 0.08 0.09 0.12 0.13 0.15 0.16 0.18 0.19 0.21 0.24 0.24 0.25 0.25 0.26 0.27 0.27 0.27 0.28 0.28 0.28 0.29 0.29 0.3 0.31 0.32 0.32 0.33 0.33...
 0 P(x) 0226 Given the above probability distribution for a random variableX of an experiment: 0328 0215 0.106 Find the value of the unknownprobability p that makes the above table into a valid probability distribution. a. b. INrepresents the number of suecesses in the experiment, Dctermine the expected value of X c. Determine a value of p that makes it invalid and demonstrate why
Most questions answered within 3 hours.
-
Seasonal or cyclical variation in a time-series model…
---exhibits irregular
variation that can be accounted for...
asked 50 seconds from now -
Please use Barney's VRIO framework of analysis to evaluate a
firm's competencies. Please choose a specific...
asked 12 minutes ago -
Where would you expect to have diabetes contributing to the most
DALYs in 2035, according to...
asked 13 minutes ago -
1.) Major league baseball salaries averaged $1.5 million with a
standard deviation of $1 million in...
asked 22 minutes ago -
A hedge fund is holding a three-year,
$10 million face value 6 percent annual coupon bond...
asked 33 minutes ago -
The focal length of a makeup (concave) mirror is 0.48 m. What
magnification does this mirror...
asked 37 minutes ago -
TRUE/FALSE
Long-lived assets that are tangible in nature, used in the
operations of the business, and...
asked 38 minutes ago -
A dragon biologist is setting up an experimental population of
1000 individuals. In dragons, pointy crests...
asked 49 minutes ago -
A uniform thin rod of length 0.851 m is hung from a horizontal
nail passing through...
asked 59 minutes ago -
A 747 has a cruising speed of 235 m/s at a height of 10,700
meters. The...
asked 1 hour ago -
Part 3: Arrows
Write a python program that prompts the user for a number of
columns,...
asked 1 hour ago -
Need help answering these questions!!
1. What economic concept do you find most interesting in
Macroeconomics?...
asked 1 hour ago