


Homework Answers
The solution is done showing all steps with necessary calculations and required explanations. A Z-score table is also attached for better understanding. Hope you can understand.

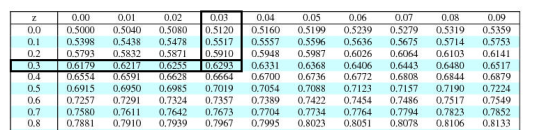
Z-score table-
Add Answer to:
HOMEWOIK. Modules mulleWUIR (LI. Score: 0 of 1 pt 7.2.15 Find the Z-score such that the...
Score: 0.33 of 1 pt 13 of 16 (14 complete) 7.2.47 The mean incubation time of...
 Score: 0.33 of 1 pt 13 of 16 (14 complete) 7.2.47 The mean incubation time of fertilized eggs is 19 days. Suppose the incubation times are approximately normally distributed with a standard deviation of 1 da (a) Determine the 14th percentile for incubation times. (b) Determine the incubation times that make up the middle 97%. Click the icon to view a table of areas under the normal curve (a) The 14th percentile for incubation times is days. (Round to the...
SCUTE. V ULIC 13 01 '16 (12 complele) 7.2.47 The mean incubation time of fertilized eggs...
 SCUTE. V ULIC 13 01 '16 (12 complele) 7.2.47 The mean incubation time of fertilized eggs is 21 days. Suppose the incubation times are approximately normally distributed with a standard deviation of 1 day (a) Determine the 10th percentile for incubation times. (b) Determine the incubation times that make up the middle 97%. = Click the icon to view a table of areas under the normal curve. (a) The 10th percentile for incubation times is days. (Round to the nearest...
Two questions For each of the following questions: clearly indicate the probability distribution being used to...
 Two questions
For each of the following questions: clearly indicate the probability distribution being used to solve the problem solve by hand, and verify your answer using MATLAB. 1. Two teams, A and B, play a series of games. If team B has a probability 0.4 of winning each game, is it to their advantage to play the best three out of five games or the best four out of seven, and why? Assume the outcomes of successive games are...
Two questions
For each of the following questions: clearly indicate the probability distribution being used to solve the problem solve by hand, and verify your answer using MATLAB. 1. Two teams, A and B, play a series of games. If team B has a probability 0.4 of winning each game, is it to their advantage to play the best three out of five games or the best four out of seven, and why? Assume the outcomes of successive games are...
Question Help 5.3.29 Find the z-scores for which 28% of the distribution's area lies between -z...
 Question Help 5.3.29 Find the z-scores for which 28% of the distribution's area lies between -z and z Click to view page 1 of the table Click to view page 2 of the table The z-scores are (Use a comma to separate answers as needed. Round to two decimal places as needed.) Enter your answer in the answer box and then click Check Answer All parts showing Clear All Check Arswer X Standard Normal Table (Page 1) 0.04 3.4 0.0002...
8.4.22 :3 Question Help The heights of 1000 students are approximately normally distributed with a mean...
 8.4.22 :3 Question Help The heights of 1000 students are approximately normally distributed with a mean of 177.7 centimeters and a standard deviation of 7.2 centimeters. Suppose 200 random samples of size 25 are drawn from this population and the means recorded to the nearest tenth of a centimeter. Complete parts (a) through (c) below. Click here to view page 1 of the standard normal distribution table. Click here to view page 2 of the standard normal distribution table. 0...
Find the value of z if the area under a standard normal curve (a) to the right of z is 0.3974; (b...
 Round to 2 decimal places
Table # 1
Table # 2
Find the value of z if the area under a standard normal curve (a) to the right of z is 0.3974; (b) to the left of z is 0.0985 (c) between 0 and z, with z > 0, is 0.4812, and (d) between -z and z, with z>0, is 0.9476 lick here to view page 1 of the standard normal distribution table le reas under the Normal Curve ,00...
Round to 2 decimal places
Table # 1
Table # 2
Find the value of z if the area under a standard normal curve (a) to the right of z is 0.3974; (b) to the left of z is 0.0985 (c) between 0 and z, with z > 0, is 0.4812, and (d) between -z and z, with z>0, is 0.9476 lick here to view page 1 of the standard normal distribution table le reas under the Normal Curve ,00...
Problem 7 Question Help * David Polston prints up T-shirts to be sold at local concerts....
 Problem 7 Question Help * David Polston prints up T-shirts to be sold at local concerts. The T-shirts sell for $24.20 each but cost David only $8.90 each. However, because the T-shirts have concert-specific information on them, David can sell a leftover shirt for only $1.00. Suppose the demand for shirts can be approximated with a normal distribution and the mean demand is 380 shirts, with a standard deviation of 65. Click the icon to view the normal probability table...
VI HW Score: 23.53%, 4 of 17 pts 25.3.9 Question Help se the standard normal table...
 VI HW Score: 23.53%, 4 of 17 pts 25.3.9 Question Help se the standard normal table to find the 2-score that corresponds to the given percentile. If the area is not in the table, use the entry closest to the area. If the area is hallway between two entries, use the score halay between the corresponding 2-cores. If convenient, use technology to find the score P20 Click to view page 1 of the title Click to view. 2 of the...
Are 0 0.66 0.07 .08 0.00 0.01 0.09 0.02 0.0003 0.0005 0.0007 0.0010 0.0013 0.0019 0.0026...
 Are 0 0.66 0.07 .08 0.00 0.01 0.09 0.02 0.0003 0.0005 0.0007 0.0010 0.0013 0.0019 0.0026 0.0035 0.0003 0.0005 0.0007 0.0009 0.0013 0.0018 0.0025 0.0034 0.0045 0.0060 0.0080 0.0104 0.01.36 0.0174 0.0003 0.0005 0.0006 0.0009 0.0013 0.0018 0.0024 0.0033 0.0044 Standard Normal Distribution 0.03 0.04 0.05 0.0003 0.0003 0.0003 0.0004 0.0004 0.0004 0.0006 0.0006 0.0006 0.0009 0.0008 0.0008 0.0012 0.0012 0.0011 0.0017 0.0016 0.0016 0.0023 0.0023 0.0022 0.0032 0.0031 0.0030 0.0043 0.0041 0.0040 0.0057 0.0055 0.0054 0.0075 0.0073 0.0071 0.0094...
please explain 3.3) [8 pts] A sample of 29 randomly selected automobile owners were asked to...
 please explain
3.3) [8 pts] A sample of 29 randomly selected automobile owners were asked to keep a record of the kilometers they travel. The random sample showed an average of 28,350 kilometers and a standard deviation of 5,237 kilometers. Assuming the underlying population is normally distributed, test the hypothesis that automobiles are driven on average more than 28,000 kilometers per year at the 10% level. Hou = 28,000 Hu> 28,000 First, specify: "If {inequality} we fail to reject the...
please explain
3.3) [8 pts] A sample of 29 randomly selected automobile owners were asked to keep a record of the kilometers they travel. The random sample showed an average of 28,350 kilometers and a standard deviation of 5,237 kilometers. Assuming the underlying population is normally distributed, test the hypothesis that automobiles are driven on average more than 28,000 kilometers per year at the 10% level. Hou = 28,000 Hu> 28,000 First, specify: "If {inequality} we fail to reject the...
 Score: 0.33 of 1 pt 13 of 16 (14 complete) 7.2.47 The mean incubation time of fertilized eggs is 19 days. Suppose the incubation times are approximately normally distributed with a standard deviation of 1 da (a) Determine the 14th percentile for incubation times. (b) Determine the incubation times that make up the middle 97%. Click the icon to view a table of areas under the normal curve (a) The 14th percentile for incubation times is days. (Round to the...
 SCUTE. V ULIC 13 01 '16 (12 complele) 7.2.47 The mean incubation time of fertilized eggs is 21 days. Suppose the incubation times are approximately normally distributed with a standard deviation of 1 day (a) Determine the 10th percentile for incubation times. (b) Determine the incubation times that make up the middle 97%. = Click the icon to view a table of areas under the normal curve. (a) The 10th percentile for incubation times is days. (Round to the nearest...
 Two questions
For each of the following questions: clearly indicate the probability distribution being used to solve the problem solve by hand, and verify your answer using MATLAB. 1. Two teams, A and B, play a series of games. If team B has a probability 0.4 of winning each game, is it to their advantage to play the best three out of five games or the best four out of seven, and why? Assume the outcomes of successive games are...
Two questions
For each of the following questions: clearly indicate the probability distribution being used to solve the problem solve by hand, and verify your answer using MATLAB. 1. Two teams, A and B, play a series of games. If team B has a probability 0.4 of winning each game, is it to their advantage to play the best three out of five games or the best four out of seven, and why? Assume the outcomes of successive games are...
 Question Help 5.3.29 Find the z-scores for which 28% of the distribution's area lies between -z and z Click to view page 1 of the table Click to view page 2 of the table The z-scores are (Use a comma to separate answers as needed. Round to two decimal places as needed.) Enter your answer in the answer box and then click Check Answer All parts showing Clear All Check Arswer X Standard Normal Table (Page 1) 0.04 3.4 0.0002...
 8.4.22 :3 Question Help The heights of 1000 students are approximately normally distributed with a mean of 177.7 centimeters and a standard deviation of 7.2 centimeters. Suppose 200 random samples of size 25 are drawn from this population and the means recorded to the nearest tenth of a centimeter. Complete parts (a) through (c) below. Click here to view page 1 of the standard normal distribution table. Click here to view page 2 of the standard normal distribution table. 0...
 Round to 2 decimal places
Table # 1
Table # 2
Find the value of z if the area under a standard normal curve (a) to the right of z is 0.3974; (b) to the left of z is 0.0985 (c) between 0 and z, with z > 0, is 0.4812, and (d) between -z and z, with z>0, is 0.9476 lick here to view page 1 of the standard normal distribution table le reas under the Normal Curve ,00...
Round to 2 decimal places
Table # 1
Table # 2
Find the value of z if the area under a standard normal curve (a) to the right of z is 0.3974; (b) to the left of z is 0.0985 (c) between 0 and z, with z > 0, is 0.4812, and (d) between -z and z, with z>0, is 0.9476 lick here to view page 1 of the standard normal distribution table le reas under the Normal Curve ,00...
 Problem 7 Question Help * David Polston prints up T-shirts to be sold at local concerts. The T-shirts sell for $24.20 each but cost David only $8.90 each. However, because the T-shirts have concert-specific information on them, David can sell a leftover shirt for only $1.00. Suppose the demand for shirts can be approximated with a normal distribution and the mean demand is 380 shirts, with a standard deviation of 65. Click the icon to view the normal probability table...
 VI HW Score: 23.53%, 4 of 17 pts 25.3.9 Question Help se the standard normal table to find the 2-score that corresponds to the given percentile. If the area is not in the table, use the entry closest to the area. If the area is hallway between two entries, use the score halay between the corresponding 2-cores. If convenient, use technology to find the score P20 Click to view page 1 of the title Click to view. 2 of the...
 Are 0 0.66 0.07 .08 0.00 0.01 0.09 0.02 0.0003 0.0005 0.0007 0.0010 0.0013 0.0019 0.0026 0.0035 0.0003 0.0005 0.0007 0.0009 0.0013 0.0018 0.0025 0.0034 0.0045 0.0060 0.0080 0.0104 0.01.36 0.0174 0.0003 0.0005 0.0006 0.0009 0.0013 0.0018 0.0024 0.0033 0.0044 Standard Normal Distribution 0.03 0.04 0.05 0.0003 0.0003 0.0003 0.0004 0.0004 0.0004 0.0006 0.0006 0.0006 0.0009 0.0008 0.0008 0.0012 0.0012 0.0011 0.0017 0.0016 0.0016 0.0023 0.0023 0.0022 0.0032 0.0031 0.0030 0.0043 0.0041 0.0040 0.0057 0.0055 0.0054 0.0075 0.0073 0.0071 0.0094...
 please explain
3.3) [8 pts] A sample of 29 randomly selected automobile owners were asked to keep a record of the kilometers they travel. The random sample showed an average of 28,350 kilometers and a standard deviation of 5,237 kilometers. Assuming the underlying population is normally distributed, test the hypothesis that automobiles are driven on average more than 28,000 kilometers per year at the 10% level. Hou = 28,000 Hu> 28,000 First, specify: "If {inequality} we fail to reject the...
please explain
3.3) [8 pts] A sample of 29 randomly selected automobile owners were asked to keep a record of the kilometers they travel. The random sample showed an average of 28,350 kilometers and a standard deviation of 5,237 kilometers. Assuming the underlying population is normally distributed, test the hypothesis that automobiles are driven on average more than 28,000 kilometers per year at the 10% level. Hou = 28,000 Hu> 28,000 First, specify: "If {inequality} we fail to reject the...
Most questions answered within 3 hours.
-
While rotating the tires on your car you notice a rock [mass =
0.1 Kg] stuck...
asked 19 minutes ago -
Using MARS simulator, write MIPS programs according to
the following scenarios: Receive a positive integer number...
asked 2 hours ago -
An object in front of a concave mirror has a real image that is
11.5 cm...
asked 2 hours ago -
Consider the reaction, C3 H8 + O2 --> CO2 + H2O. How many
moles of O2...
asked 4 hours ago -
You and your opponent both roll a fair die. If you both roll the
same number,...
asked 4 hours ago -
In a study of the accuracy of fast food drive-through orders,
Restaurant A had 257 accurate...
asked 4 hours ago -
Identify and describe in detail the four categories of
institutions that could be included in a...
asked 4 hours ago -
In python
class Customer:
def __init__(self, customer_id, last_name, first_name, phone_number, address):
self._customer_id = int(customer_id)
self._last_name =...
asked 4 hours ago -
What is an example of a limitation in implementing a new
ERP system and how it...
asked 4 hours ago -
In a section of 9.7cm of an artery with a radius of 2.6mm there
is a...
asked 4 hours ago -
the two carboxylic acid groups of aspartic acid have different
acidities with pKa values of 2.1...
asked 4 hours ago -
Would CuCO3 aqueous salt combined with calcium chloride
form a solid precipitate? If so, what would...
asked 4 hours ago