


Homework Answers


Add Answer to:
Lab 6 Mass Spectrometry Worksheet Please show your work for the following problems in your laboratory...
15. The mass spectrum of a compound appears below. The molecular ion, M+1, and M+2 peaks...
 15. The mass spectrum of a compound appears below. The molecular ion, M+1, and M+2 peaks have intensities of 100, 6.8, and 31.8 respectively. Use the information provided to determine the formula of the compound 100 MS-NW-5495 80 60 40 20 шшшl 110 10 20 30 40 50 60 70 80 90 100 m/z Relative Intensity
15. The mass spectrum of a compound appears below. The molecular ion, M+1, and M+2 peaks have intensities of 100, 6.8, and 31.8 respectively....
15. The mass spectrum of a compound appears below. The molecular ion, M+1, and M+2 peaks have intensities of 100, 6.8, and 31.8 respectively. Use the information provided to determine the formula of the compound 100 MS-NW-5495 80 60 40 20 шшшl 110 10 20 30 40 50 60 70 80 90 100 m/z Relative Intensity
15. The mass spectrum of a compound appears below. The molecular ion, M+1, and M+2 peaks have intensities of 100, 6.8, and 31.8 respectively....
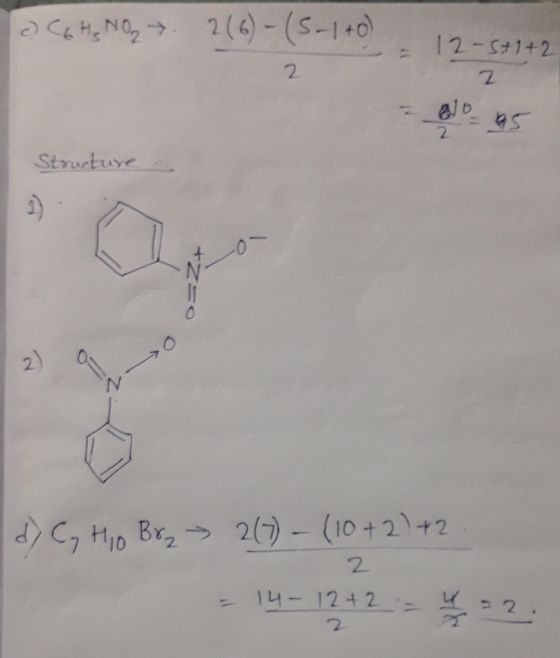
Combined IR Spectroscopy and Mass Spectrometry Problems Determine the molecular formula and possible structures for each...
 Combined IR Spectroscopy and Mass Spectrometry Problems Determine the molecular formula and possible structures for each unknown based on the given spectra. Use the IR Correlation Table. Note: DOU - Cs+1-0.5(#Hs-#Ns+Whalogens). SHOW YOUR WORK! 100 - 2191 Relative Intensity 10 15 20 25 30 40 35 m/z 45 50 55 60
Use the mass spectrum to answer the questions below Does the compound contain chlorine or bromine...
 Use the mass spectrum to answer the questions below
Does the compound contain chlorine or bromine or neither?
Explain.
Give the m/z value for the molecular ion peak.
Give the m/z value for the base peak.
The base peak is a common fragment – what is the most likely
chemical formula for the base peak?
Does the compound contain chlorine or bromine or neither?
Explain.
Give the m/z value for the molecular ion peak.
Give the m/z value for the...
Use the mass spectrum to answer the questions below
Does the compound contain chlorine or bromine or neither?
Explain.
Give the m/z value for the molecular ion peak.
Give the m/z value for the base peak.
The base peak is a common fragment – what is the most likely
chemical formula for the base peak?
Does the compound contain chlorine or bromine or neither?
Explain.
Give the m/z value for the molecular ion peak.
Give the m/z value for the...
2. (6 pts) Determine the structure of the following Show your reasoning for each type of spectra ...
 IR,
NMR, and Mass Spec; Please help determine which structures these
could be! Thank you!
2. (6 pts) Determine the structure of the following Show your reasoning for each type of spectra shown and then the complete structur compound whose spectra is shown below 80 60 40 20 3800 300025002000 1500 1000 0.0 ANALYSIS İR spectrum 0.0 ANALYSIS Mass spectrum Parent peak does not show in this specrum MW- 204 40 80 120 160 209 2983 23C+ (sp) nyo-este aret...
IR,
NMR, and Mass Spec; Please help determine which structures these
could be! Thank you!
2. (6 pts) Determine the structure of the following Show your reasoning for each type of spectra shown and then the complete structur compound whose spectra is shown below 80 60 40 20 3800 300025002000 1500 1000 0.0 ANALYSIS İR spectrum 0.0 ANALYSIS Mass spectrum Parent peak does not show in this specrum MW- 204 40 80 120 160 209 2983 23C+ (sp) nyo-este aret...
1. Consider the Mass Spectrum below to answer the following questions: MS-NU-S495 Relative Intensity 0- 10...
 1. Consider the Mass Spectrum below to answer the following questions: MS-NU-S495 Relative Intensity 0- 10 prote 20 30 40 t 50 to 60 70 m/z 80 90 100 110 a. (1 point) What is the m/z of the molecular ion peak: b. (1 point) What is the m/z value of the base peak: c. (2 point) Explain why do we observe the peak at m/z = 114 d. (2 points) The molecular formula of this compound is C.HSX. Identify...
label each major peak with a molecular formula (including charge) label the molecular ion peak as "M+" (if present) labe...
 label each major peak with a molecular formula (including
charge)
label the molecular ion peak as "M+" (if present)
label major peaks other than the molecular ion with three
things:
1) the mass to charge ratio
2) the structure or formula for that charged fragment
3) another formula to show which fragment was lost by the molecular
ion to form that ion
Mass spec NEUTRAL COMPOUND 100- 80 2-6utanene 60 40 20- 75 60 65 70 35 40 45 10...
label each major peak with a molecular formula (including
charge)
label the molecular ion peak as "M+" (if present)
label major peaks other than the molecular ion with three
things:
1) the mass to charge ratio
2) the structure or formula for that charged fragment
3) another formula to show which fragment was lost by the molecular
ion to form that ion
Mass spec NEUTRAL COMPOUND 100- 80 2-6utanene 60 40 20- 75 60 65 70 35 40 45 10...
Problem 1 Elemental Analysis: C, 64.82: H, 13.60; o, 21.58 Mass of molecular ion: 74 100...
 Problem 1 Elemental Analysis: C, 64.82: H, 13.60; o, 21.58 Mass of molecular ion: 74 100 70 80 10 20 04 60 70 m/z Analysis problem 1 Empirical formula Molecular Formula Hydrogen Deficiency Index: SPECTRA ANALYSIS TELLS ME.. MS IR NMR Structure AND explanation: Problem 2 Elemental Analysis: C, 73.63; H, 12.30, 0, 1401 Mass of molecular ion: 114 100 10 20 40 0 0 70 80 9 100 110 m/z 3H Copyrigh19 ai 2.0 t.0 PPM 0. Analysis problem...
I need #2 answered Spectroscopy Problem Set15pts CHEM220B Spring 2019 1. Unknown number 44 SU 2....
 I need #2 answered
Spectroscopy Problem Set15pts CHEM220B Spring 2019 1. Unknown number 44 SU 2. Mass Spectrum (3pts) a. Molecular lon m/z value l08 Attach your unknown spectra to this sheet. and structure of the Molecular lon b. Base Peak m/z value and structure of that ion c. One other significant peak m/z value and structure of that ion 3. C13 NMR Spectrum (3pts) Draw Structure of Compound on the C13 NMR spectrum and identify each signal with the...
I need #2 answered
Spectroscopy Problem Set15pts CHEM220B Spring 2019 1. Unknown number 44 SU 2. Mass Spectrum (3pts) a. Molecular lon m/z value l08 Attach your unknown spectra to this sheet. and structure of the Molecular lon b. Base Peak m/z value and structure of that ion c. One other significant peak m/z value and structure of that ion 3. C13 NMR Spectrum (3pts) Draw Structure of Compound on the C13 NMR spectrum and identify each signal with the...
This is for my mass spectrometry lab report. I have to figure out the m/z of...
 This is for my mass spectrometry lab report.
I have to figure out the m/z of the base peak and in order to
do so I need to know where the weakest bond is for each compound so
I can split them up.
Please do that for me for each of the compound. I just want to
double check my work.
I’ve attached on the second picture an example of one of the
compound.
Thank you ahead of time!!!
Step...
This is for my mass spectrometry lab report.
I have to figure out the m/z of the base peak and in order to
do so I need to know where the weakest bond is for each compound so
I can split them up.
Please do that for me for each of the compound. I just want to
double check my work.
I’ve attached on the second picture an example of one of the
compound.
Thank you ahead of time!!!
Step...
16. A hydrocarbon with a molecular weight of 100 Da (and expected molecular ion at 100 m 2) was analyzed by mass...
 16. A hydrocarbon with a molecular weight of 100 Da (and expected molecular ion at 100 m 2) was analyzed by mass spectrometry and gave the spectra shown below. Based on the MS spectrum and considering possible fragmentation of the hydrocarbon, which of the molecules provided corresponds to this spectrum? 100- m/z = 57 Da Relative Intensity m/z = 85 Da Expected molecular ion (not observed) 10 20 30 40 tillo el origen los 50 60 70 80 90 100...
 15. The mass spectrum of a compound appears below. The molecular ion, M+1, and M+2 peaks have intensities of 100, 6.8, and 31.8 respectively. Use the information provided to determine the formula of the compound 100 MS-NW-5495 80 60 40 20 шшшl 110 10 20 30 40 50 60 70 80 90 100 m/z Relative Intensity
15. The mass spectrum of a compound appears below. The molecular ion, M+1, and M+2 peaks have intensities of 100, 6.8, and 31.8 respectively....
15. The mass spectrum of a compound appears below. The molecular ion, M+1, and M+2 peaks have intensities of 100, 6.8, and 31.8 respectively. Use the information provided to determine the formula of the compound 100 MS-NW-5495 80 60 40 20 шшшl 110 10 20 30 40 50 60 70 80 90 100 m/z Relative Intensity
15. The mass spectrum of a compound appears below. The molecular ion, M+1, and M+2 peaks have intensities of 100, 6.8, and 31.8 respectively....
 Combined IR Spectroscopy and Mass Spectrometry Problems Determine the molecular formula and possible structures for each unknown based on the given spectra. Use the IR Correlation Table. Note: DOU - Cs+1-0.5(#Hs-#Ns+Whalogens). SHOW YOUR WORK! 100 - 2191 Relative Intensity 10 15 20 25 30 40 35 m/z 45 50 55 60
 Use the mass spectrum to answer the questions below
Does the compound contain chlorine or bromine or neither?
Explain.
Give the m/z value for the molecular ion peak.
Give the m/z value for the base peak.
The base peak is a common fragment – what is the most likely
chemical formula for the base peak?
Does the compound contain chlorine or bromine or neither?
Explain.
Give the m/z value for the molecular ion peak.
Give the m/z value for the...
Use the mass spectrum to answer the questions below
Does the compound contain chlorine or bromine or neither?
Explain.
Give the m/z value for the molecular ion peak.
Give the m/z value for the base peak.
The base peak is a common fragment – what is the most likely
chemical formula for the base peak?
Does the compound contain chlorine or bromine or neither?
Explain.
Give the m/z value for the molecular ion peak.
Give the m/z value for the...
 IR,
NMR, and Mass Spec; Please help determine which structures these
could be! Thank you!
2. (6 pts) Determine the structure of the following Show your reasoning for each type of spectra shown and then the complete structur compound whose spectra is shown below 80 60 40 20 3800 300025002000 1500 1000 0.0 ANALYSIS İR spectrum 0.0 ANALYSIS Mass spectrum Parent peak does not show in this specrum MW- 204 40 80 120 160 209 2983 23C+ (sp) nyo-este aret...
IR,
NMR, and Mass Spec; Please help determine which structures these
could be! Thank you!
2. (6 pts) Determine the structure of the following Show your reasoning for each type of spectra shown and then the complete structur compound whose spectra is shown below 80 60 40 20 3800 300025002000 1500 1000 0.0 ANALYSIS İR spectrum 0.0 ANALYSIS Mass spectrum Parent peak does not show in this specrum MW- 204 40 80 120 160 209 2983 23C+ (sp) nyo-este aret...
 1. Consider the Mass Spectrum below to answer the following questions: MS-NU-S495 Relative Intensity 0- 10 prote 20 30 40 t 50 to 60 70 m/z 80 90 100 110 a. (1 point) What is the m/z of the molecular ion peak: b. (1 point) What is the m/z value of the base peak: c. (2 point) Explain why do we observe the peak at m/z = 114 d. (2 points) The molecular formula of this compound is C.HSX. Identify...
 label each major peak with a molecular formula (including
charge)
label the molecular ion peak as "M+" (if present)
label major peaks other than the molecular ion with three
things:
1) the mass to charge ratio
2) the structure or formula for that charged fragment
3) another formula to show which fragment was lost by the molecular
ion to form that ion
Mass spec NEUTRAL COMPOUND 100- 80 2-6utanene 60 40 20- 75 60 65 70 35 40 45 10...
label each major peak with a molecular formula (including
charge)
label the molecular ion peak as "M+" (if present)
label major peaks other than the molecular ion with three
things:
1) the mass to charge ratio
2) the structure or formula for that charged fragment
3) another formula to show which fragment was lost by the molecular
ion to form that ion
Mass spec NEUTRAL COMPOUND 100- 80 2-6utanene 60 40 20- 75 60 65 70 35 40 45 10...
 Problem 1 Elemental Analysis: C, 64.82: H, 13.60; o, 21.58 Mass of molecular ion: 74 100 70 80 10 20 04 60 70 m/z Analysis problem 1 Empirical formula Molecular Formula Hydrogen Deficiency Index: SPECTRA ANALYSIS TELLS ME.. MS IR NMR Structure AND explanation: Problem 2 Elemental Analysis: C, 73.63; H, 12.30, 0, 1401 Mass of molecular ion: 114 100 10 20 40 0 0 70 80 9 100 110 m/z 3H Copyrigh19 ai 2.0 t.0 PPM 0. Analysis problem...
 I need #2 answered
Spectroscopy Problem Set15pts CHEM220B Spring 2019 1. Unknown number 44 SU 2. Mass Spectrum (3pts) a. Molecular lon m/z value l08 Attach your unknown spectra to this sheet. and structure of the Molecular lon b. Base Peak m/z value and structure of that ion c. One other significant peak m/z value and structure of that ion 3. C13 NMR Spectrum (3pts) Draw Structure of Compound on the C13 NMR spectrum and identify each signal with the...
I need #2 answered
Spectroscopy Problem Set15pts CHEM220B Spring 2019 1. Unknown number 44 SU 2. Mass Spectrum (3pts) a. Molecular lon m/z value l08 Attach your unknown spectra to this sheet. and structure of the Molecular lon b. Base Peak m/z value and structure of that ion c. One other significant peak m/z value and structure of that ion 3. C13 NMR Spectrum (3pts) Draw Structure of Compound on the C13 NMR spectrum and identify each signal with the...
 This is for my mass spectrometry lab report.
I have to figure out the m/z of the base peak and in order to
do so I need to know where the weakest bond is for each compound so
I can split them up.
Please do that for me for each of the compound. I just want to
double check my work.
I’ve attached on the second picture an example of one of the
compound.
Thank you ahead of time!!!
Step...
This is for my mass spectrometry lab report.
I have to figure out the m/z of the base peak and in order to
do so I need to know where the weakest bond is for each compound so
I can split them up.
Please do that for me for each of the compound. I just want to
double check my work.
I’ve attached on the second picture an example of one of the
compound.
Thank you ahead of time!!!
Step...
 16. A hydrocarbon with a molecular weight of 100 Da (and expected molecular ion at 100 m 2) was analyzed by mass spectrometry and gave the spectra shown below. Based on the MS spectrum and considering possible fragmentation of the hydrocarbon, which of the molecules provided corresponds to this spectrum? 100- m/z = 57 Da Relative Intensity m/z = 85 Da Expected molecular ion (not observed) 10 20 30 40 tillo el origen los 50 60 70 80 90 100...
Most questions answered within 3 hours.
-
A travelling salesman sells milkshake mixing machines and on
average sells 8.9 machines per month. He...
asked 2 minutes ago -
what's the danger in the fact that the market value of a stock
is based on...
asked 17 minutes ago -
Describe how do you feel about the post below and
why?
Listening to the podcast reaffirmed...
asked 26 minutes ago -
To start an avalanche on a mountain slope, an artillery shell is
fired with an initial...
asked 38 minutes ago -
The population of bacteria in a culture can be modeled by P left
parenthesis t right...
asked 43 minutes ago -
Which factors can prevent permanent fixation of an allele (i.e.
maintain genetic diversity)? Hint: You're going...
asked 45 minutes ago -
Compare a two-year bond with two successive one-year bonds in a
situation in which an investor...
asked 1 hour ago -
Chapter 6
Search the internet and find a newspaper example of a price
ceiling, price floor...
asked 1 hour ago -
Sarah Bates, calendar year taxpayer, started a new business on
October 8th. A number of start-up...
asked 1 hour ago -
You and your friends are playing in the swimming pool with a
40-cm-diameter beach ball. How...
asked 1 hour ago -
Patterson Development sometimes sells property on an installment
basis. In those cases, Patterson reports income in...
asked 1 hour ago -
please help with these two example, i want to double check my
work. thanks
1.
sum:=0...
asked 1 hour ago