Draw a graph illustrating the quantity the perfectly price discriminating monopolist will produce. Use a straight-line...
Draw a graph illustrating the quantity the perfectly price discriminating monopolist will produce. Use a straight-line demand curve, and include MC and ATC. On the graph fill in the economic profit of monopolist engaging in perfect price discrimination.
Homework Answers
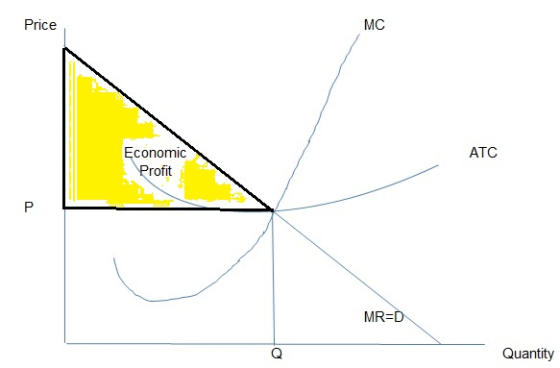
Under perfect price discrimination, a monopolist will will produce quantity Q where MC=MR. The MR curve is same as the demand curve and it charges different prices associated with that quantity of good.
Add Answer to:
Draw a graph illustrating the quantity the perfectly price
discriminating monopolist will produce. Use a straight-line...
3. (Figure: Price-Discriminating Monopolist 2) The perfectly price-discriminating monopolist in this diagram will produce units of...
 3. (Figure: Price-Discriminating Monopolist 2) The perfectly price-discriminating monopolist in this diagram will produce units of output, and a single price monopolist would produce units of output. Consumer surplus under a perfectly price discriminating monopolist is dollars less than under a single-price monopolist. While, perfect price discrimination results in reduced consumer surplus, it (increases/decreases) producer surplus and ultimately results in deadweight loss that is (less than/equal to greater than the amount of deadweight loss found in a perfectly competitive market....
The perfect price-discriminating monopolist in this diagram will produce ____ units of output, and a single-price...
 The perfect price-discriminating monopolist in this diagram will
produce ____ units of output, and a single-price monopolist would
produce _____ units of output. Consumer surplus under a perfectly
price discriminating monopolist is _____ dollars than under a
single-price monopolist. While, perfect price discrimination
results in reduced consumer surplus, it (increases/decreases)
producer surplus and ultimately results in deadweight loss that is
(less than/greater than/equal to) the amount of deadweight loss
found in a perfectly competitive market.
3 5 points Price $10...
The perfect price-discriminating monopolist in this diagram will
produce ____ units of output, and a single-price monopolist would
produce _____ units of output. Consumer surplus under a perfectly
price discriminating monopolist is _____ dollars than under a
single-price monopolist. While, perfect price discrimination
results in reduced consumer surplus, it (increases/decreases)
producer surplus and ultimately results in deadweight loss that is
(less than/greater than/equal to) the amount of deadweight loss
found in a perfectly competitive market.
3 5 points Price $10...
Price Discriminating Monopolist vs. Single Price Monopolist I have 4/5 answers to the question correct, but I do not kno...
 Price Discriminating Monopolist vs. Single Price Monopolist
I have 4/5 answers to the question correct, but I do not know
which ones, and I cannot seem to figure out which one I have
incorrect. My answers are:
8
4
8
increases
Less Than
3. (Figure: Price-Discriminating Monopolist 2) The perfectly price-discriminating monopolist in this diagram will produce units of output, and a single-price monopolist would produce units of output. Consumer surplus under a perfectly price discriminating monopolist is_ dollars less...
Price Discriminating Monopolist vs. Single Price Monopolist
I have 4/5 answers to the question correct, but I do not know
which ones, and I cannot seem to figure out which one I have
incorrect. My answers are:
8
4
8
increases
Less Than
3. (Figure: Price-Discriminating Monopolist 2) The perfectly price-discriminating monopolist in this diagram will produce units of output, and a single-price monopolist would produce units of output. Consumer surplus under a perfectly price discriminating monopolist is_ dollars less...
5. Assume the graph below represents the market for a monopolist. What quantity will the monopolist...
 5. Assume the graph below represents the market for a monopolist. What quantity will the monopolist produce, and what price will she charge? What will her total revenue, costs, and profit be at this level of production? What will the deadweight loss for society be at this level of production? (Assume the MC curve is a straight line between the relevant points for this calculation.) Revenue and costs $34 Demand MR 600 800 940 1160 Quantity
Suppose that a price-discriminating monopolist has segregated its market into two groups of buyers as shown...
 Suppose that a price-discriminating monopolist has segregated its market into two groups of buyers as shown in the table below. a. Calculate the missing total-revenue and marginal-revenue amounts for Group 1. Instructions: Enter your answers as whole numbers in the gray-shaded cells. If you are entering any negative numbers be sure to include a negative sign (-) in front of those numbers. Group 1 Group 2 Price Quantity Total Marginal Total Quantity Marginal Demanded Revenue Price Revenue Demanded Revenue Revenue...
Graph a Monopoly, make sure to include the Price, Quantity, Demand, MR, MC, ATC, and Profit...
Graph a Monopoly, make sure to include the Price, Quantity, Demand, MR, MC, ATC, and Profit Compare the price, quantity, and ATC of a monopoly with a perfectly competitive firm. Who is more efficient and why?
Consider the market demand function in the graph below. Use the straight-line tool to draw a...
 Consider the market demand function in the graph below. Use the straight-line tool to draw a line that overlaps with the portion of the demand function that is inelastic (include the portion of the demand curve that is unit elastic). To refer to the graphing tutorial for this question type, please click here. Price Quantity
Include correctly labeled diagrams, if useful or required, in explaining your answers. A correctly labeled diagram...
Include correctly labeled diagrams, if useful or required, in explaining your answers. A correctly labeled diagram must have all axes and curves clearly labeled and must show directional changes. If the question prompts you to "Calculate," you must show how you arrived at your final answer (a) Draw a correctly labeled graph for a monopoly and show each of the following. The profit-maximizing quantity, labeled QM (II) The profit maximizing price, labeled PM (b) Assume the monopoly now engages in...
Graph Worksheet 01 02 03 1. What is the price and quantity at the optimum level...
 Graph Worksheet 01 02 03 1. What is the price and quantity at the optimum level of production? Is this an economic profit, loss, or break-even? Should the firm produce? 2. If the industry model is monopolistic competition, what will happen to the industry? What will happen to the demand and marginal revenue curves for the individual firm? In the long run, where will the demand curve be? Will the firm achieve productive and/or allocative efficiency? 3. If the industry...
help. agricultural economic 2. Use the following graph to answer the following questions: P/ MC ATC...
 help. agricultural economic
2. Use the following graph to answer the following questions: P/ MC ATC /AVC MR 20 2528 50 a. What price is charged by the monopol order to maximize profits? b. Calculate the total revenue accruing to the mo- nopolist at the profit-maximizing output. C. Calculate the total cost to the monopolist at the profit-maximizing output. d. Calculate the profit for the monopolist. e. Calculate the total variable and fixed costs of the monopolist at the profit-maximizing...
help. agricultural economic
2. Use the following graph to answer the following questions: P/ MC ATC /AVC MR 20 2528 50 a. What price is charged by the monopol order to maximize profits? b. Calculate the total revenue accruing to the mo- nopolist at the profit-maximizing output. C. Calculate the total cost to the monopolist at the profit-maximizing output. d. Calculate the profit for the monopolist. e. Calculate the total variable and fixed costs of the monopolist at the profit-maximizing...
 3. (Figure: Price-Discriminating Monopolist 2) The perfectly price-discriminating monopolist in this diagram will produce units of output, and a single price monopolist would produce units of output. Consumer surplus under a perfectly price discriminating monopolist is dollars less than under a single-price monopolist. While, perfect price discrimination results in reduced consumer surplus, it (increases/decreases) producer surplus and ultimately results in deadweight loss that is (less than/equal to greater than the amount of deadweight loss found in a perfectly competitive market....
 The perfect price-discriminating monopolist in this diagram will
produce ____ units of output, and a single-price monopolist would
produce _____ units of output. Consumer surplus under a perfectly
price discriminating monopolist is _____ dollars than under a
single-price monopolist. While, perfect price discrimination
results in reduced consumer surplus, it (increases/decreases)
producer surplus and ultimately results in deadweight loss that is
(less than/greater than/equal to) the amount of deadweight loss
found in a perfectly competitive market.
3 5 points Price $10...
The perfect price-discriminating monopolist in this diagram will
produce ____ units of output, and a single-price monopolist would
produce _____ units of output. Consumer surplus under a perfectly
price discriminating monopolist is _____ dollars than under a
single-price monopolist. While, perfect price discrimination
results in reduced consumer surplus, it (increases/decreases)
producer surplus and ultimately results in deadweight loss that is
(less than/greater than/equal to) the amount of deadweight loss
found in a perfectly competitive market.
3 5 points Price $10...
 Price Discriminating Monopolist vs. Single Price Monopolist
I have 4/5 answers to the question correct, but I do not know
which ones, and I cannot seem to figure out which one I have
incorrect. My answers are:
8
4
8
increases
Less Than
3. (Figure: Price-Discriminating Monopolist 2) The perfectly price-discriminating monopolist in this diagram will produce units of output, and a single-price monopolist would produce units of output. Consumer surplus under a perfectly price discriminating monopolist is_ dollars less...
Price Discriminating Monopolist vs. Single Price Monopolist
I have 4/5 answers to the question correct, but I do not know
which ones, and I cannot seem to figure out which one I have
incorrect. My answers are:
8
4
8
increases
Less Than
3. (Figure: Price-Discriminating Monopolist 2) The perfectly price-discriminating monopolist in this diagram will produce units of output, and a single-price monopolist would produce units of output. Consumer surplus under a perfectly price discriminating monopolist is_ dollars less...
 5. Assume the graph below represents the market for a monopolist. What quantity will the monopolist produce, and what price will she charge? What will her total revenue, costs, and profit be at this level of production? What will the deadweight loss for society be at this level of production? (Assume the MC curve is a straight line between the relevant points for this calculation.) Revenue and costs $34 Demand MR 600 800 940 1160 Quantity
 Suppose that a price-discriminating monopolist has segregated its market into two groups of buyers as shown in the table below. a. Calculate the missing total-revenue and marginal-revenue amounts for Group 1. Instructions: Enter your answers as whole numbers in the gray-shaded cells. If you are entering any negative numbers be sure to include a negative sign (-) in front of those numbers. Group 1 Group 2 Price Quantity Total Marginal Total Quantity Marginal Demanded Revenue Price Revenue Demanded Revenue Revenue...
 Consider the market demand function in the graph below. Use the straight-line tool to draw a line that overlaps with the portion of the demand function that is inelastic (include the portion of the demand curve that is unit elastic). To refer to the graphing tutorial for this question type, please click here. Price Quantity
 Graph Worksheet 01 02 03 1. What is the price and quantity at the optimum level of production? Is this an economic profit, loss, or break-even? Should the firm produce? 2. If the industry model is monopolistic competition, what will happen to the industry? What will happen to the demand and marginal revenue curves for the individual firm? In the long run, where will the demand curve be? Will the firm achieve productive and/or allocative efficiency? 3. If the industry...
 help. agricultural economic
2. Use the following graph to answer the following questions: P/ MC ATC /AVC MR 20 2528 50 a. What price is charged by the monopol order to maximize profits? b. Calculate the total revenue accruing to the mo- nopolist at the profit-maximizing output. C. Calculate the total cost to the monopolist at the profit-maximizing output. d. Calculate the profit for the monopolist. e. Calculate the total variable and fixed costs of the monopolist at the profit-maximizing...
help. agricultural economic
2. Use the following graph to answer the following questions: P/ MC ATC /AVC MR 20 2528 50 a. What price is charged by the monopol order to maximize profits? b. Calculate the total revenue accruing to the mo- nopolist at the profit-maximizing output. C. Calculate the total cost to the monopolist at the profit-maximizing output. d. Calculate the profit for the monopolist. e. Calculate the total variable and fixed costs of the monopolist at the profit-maximizing...
Most questions answered within 3 hours.
-
On the Apollo 14 mission to the moon, astronaut Alan Shepard hit
a golf ball with...
asked 1 minute from now -
Six years of quarterly data of a seasonally adjusted series are
used to estimate a linear...
asked 37 seconds from now -
Which of the following is not an ecological model used
to foster behavior change?
PRECEDE-PROCEED Model...
asked 2 minutes ago -
What are John’s potential claims if he is terminated
this week?
John is a 54-year-old man...
asked 12 minutes ago -
A (8.5) cm tall object is placed at a distance of (14.2) cm from
a convex...
asked 20 minutes ago -
(2) For the following questions, consider a data set that
exhibits a normal distribution. Report the...
asked 21 minutes ago -
What exactly is an information system? How does it work" What
are its people organization,
...
asked 23 minutes ago -
The Food Marketing Institute shows that 17% of households spend
more than $100 per week on...
asked 32 minutes ago -
Go to NCBI BLAST search web page
1st search: GEKDLRRAKDINQEVYNF
2nd search: PTSQRLQLLEPFDK
3rd search: GEKDLRRAKDINQEVYNF...
asked 36 minutes ago -
Explain how each of the following three conditions could be a
red flag for a register...
asked 40 minutes ago -
In a two-way factorial ANOVA, the final F-ratio for
factor AxB is determined by dividing _____...
asked 1 hour ago -
Show your solutions for answer.
4. An aqueous solution contains 9.21 g of
K4Fe(CN)6 in a...
asked 41 minutes ago