
Homework Answers
1) In a cash flow diagram, all cash inflows are shown by upward arrow keys and all cash outflows are shown by downward arrow keys.
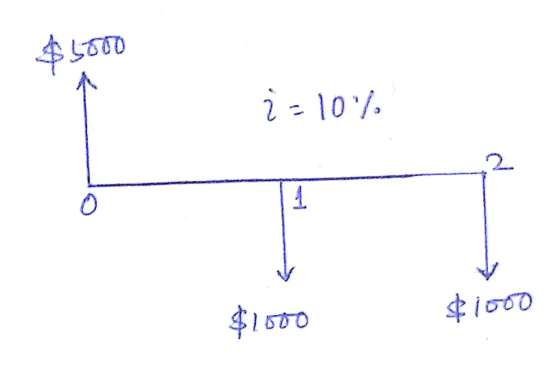
2) Future Value = P(F/P, i, n) - A(F/A, i, n)
= 5000(F/P, 10%, 2) - 1000(F/A, 10%, 2)
= 5000(1.210) - 1000(2.100)
= 6050 - 2100
= $3,950
Add Answer to:
Draw diagram clearly and answer completely for rating
$5,000 inflow at time zero, $1000 per year...
Please clearly answer all questions and include the diagrams for a positive rating .Vision Technologies, Inc....
 Please clearly answer all questions and include the diagrams
for a positive rating
.Vision Technologies, Inc. is a small company that uses ultra-wideband technology to develop devices that can detect objects (including people) inside buildings, behind walls, or below ground. The company expects to spend $100,000 per year for labor and S125,000 per year for supplies before a product can be marketed. If the company wants to know the total equivalent future amount of the company's expenses at the end...
Please clearly answer all questions and include the diagrams
for a positive rating
.Vision Technologies, Inc. is a small company that uses ultra-wideband technology to develop devices that can detect objects (including people) inside buildings, behind walls, or below ground. The company expects to spend $100,000 per year for labor and S125,000 per year for supplies before a product can be marketed. If the company wants to know the total equivalent future amount of the company's expenses at the end...
Show math and procedure for each question for a positive rating .Vision Technologies, Inc. is a...
 Show math and procedure for each question for a positive
rating
.Vision Technologies, Inc. is a small company that uses ultra-wideband technology to develop devices that can detect objects (including people) inside buildings, behind walls, or below ground. The company expects to spend $100,000 per year for labor and S125,000 per year for supplies before a product can be marketed. If the company wants to know the total equivalent future amount of the company's expenses at the end of 3...
Show math and procedure for each question for a positive
rating
.Vision Technologies, Inc. is a small company that uses ultra-wideband technology to develop devices that can detect objects (including people) inside buildings, behind walls, or below ground. The company expects to spend $100,000 per year for labor and S125,000 per year for supplies before a product can be marketed. If the company wants to know the total equivalent future amount of the company's expenses at the end of 3...
Construct a cash flow diagram for the following cash flows: $25,000 outflow at time 0, $9000...
 Construct a cash flow diagram for the following cash flows: $25,000 outflow at time 0, $9000 per year inflow in years 1 through 5 at an interest rate of 10% per year, and an unknown future amount in year 5. 4. If a company sets aside $1,000,000 now into a contingency fund, how much will the company have in 2 years, if it does not use any of the money and the account grows at a rate of 10% per...
Please draw diagram and include formulas for positive rating One company is working on a new...
 Please draw diagram and include formulas for positive
rating
One company is working on a new project. What is the present worth of the project if the annual cost (years 1 through 5) is $8 million per year? What would the equivalent amount be 6 years from now? Interest rte 10% per year. (Cash flow diagram + calculation)
Please draw diagram and include formulas for positive
rating
One company is working on a new project. What is the present worth of the project if the annual cost (years 1 through 5) is $8 million per year? What would the equivalent amount be 6 years from now? Interest rte 10% per year. (Cash flow diagram + calculation)
please draw the cash flow diagram Q2: A person invests 1000$ in the first year, 1500$...
 please draw the cash flow diagram
Q2: A person invests 1000$ in the first year, 1500$ in the second year, 1800$ in the third year, 1200$ in the fourth year and 2000% in the fifth year. At an annual compound interest rate of 8%: 1. Calculate present worth (P). 2. Calculate future worth (F). Note: solve by either the equations or tables.
please draw the cash flow diagram
Q2: A person invests 1000$ in the first year, 1500$ in the second year, 1800$ in the third year, 1200$ in the fourth year and 2000% in the fifth year. At an annual compound interest rate of 8%: 1. Calculate present worth (P). 2. Calculate future worth (F). Note: solve by either the equations or tables.
Problem (1): For the following table and interest rate of 10% per year End of Year...
 Problem (1): For the following table and interest rate of 10% per year End of Year Revenue (SR) Expenses (SR) 0 1 0 0 2000 200 2 500 200 3 600 200 4 700 0 5 800 0 6 1000 0 7 1000 0 8 1000 2000 1. Draw the Cash flow Diagram. 2. Calculate the equivalent Present worth (PW).
80 Points Draw and solve the Cash Flow Diagram for Future Value “F12". The data below...
 80 Points Draw and solve the Cash Flow Diagram for Future Value “F12". The data below is a 10 year Cash Flow, and interest rate is a compounded 7%). Don't just use F/P and P/F. Use the best "tool” for each item below a. $10,000.00 is Invested Today for a piece of testing equipment b. $2000.00 is Earned as Annual Income from end of years 1-10 through use of this test equipment c. $400.00 is the Annual Maintenance Cost of...
1. The unit cost of installing a solar power system per km² was $5,000 in 2010...
 1. The unit cost of installing a solar power system per km² was $5,000 in 2010 when the construction cost index was 1,850. Construction of a 5 MW power system requires 50 km² of land. Estimate the cost of constructing a solar power system of 20 MW in 2020 given that the construction cost index is 2,450 and the size-factor is 0.75? 2. A company that manufactures general-purpose transducers invested $2 million four years ago in high-yield junk box bonds....
please help.. Problem 1 For the following table (a) Draw the cash flow diagram Receipts Year...
 please help..
Problem 1 For the following table (a) Draw the cash flow diagram Receipts Year 0 1 2 Disbursements $50,000 $15,000 $15,000 2 S5.000 System Initial Costs Produced Products Produced Products Preventive Maintance Produced Products Corrective Maintance Produced Products Preventive Maintance Produced Products Salvage value $15,000 $15,000 $15,000 $5,000 4 5 5 6 $15,000 $25,000 Problem 2 $1000 is deposited in a savinga account that pays 6% annual interest, and no money is withdrawn for three years. Most nearly,...
please help..
Problem 1 For the following table (a) Draw the cash flow diagram Receipts Year 0 1 2 Disbursements $50,000 $15,000 $15,000 2 S5.000 System Initial Costs Produced Products Produced Products Preventive Maintance Produced Products Corrective Maintance Produced Products Preventive Maintance Produced Products Salvage value $15,000 $15,000 $15,000 $5,000 4 5 5 6 $15,000 $25,000 Problem 2 $1000 is deposited in a savinga account that pays 6% annual interest, and no money is withdrawn for three years. Most nearly,...
Please read the questions carefully. Please draw the cash flow diagrams and explain the steps that...
 Please read the questions carefully. Please draw the cash flow diagrams and explain the steps that you are going to approach to solve the problems then solve the problem. Show the details in solving the problems. Please write legible hand writing, otherwise there is a deduction from your grade 10 points Missing Cash Flow Diagram is deductible points equal to 10% of the total points for each question. Question - 1 A series of equal semiannual cash flows starts with...
 Please clearly answer all questions and include the diagrams
for a positive rating
.Vision Technologies, Inc. is a small company that uses ultra-wideband technology to develop devices that can detect objects (including people) inside buildings, behind walls, or below ground. The company expects to spend $100,000 per year for labor and S125,000 per year for supplies before a product can be marketed. If the company wants to know the total equivalent future amount of the company's expenses at the end...
Please clearly answer all questions and include the diagrams
for a positive rating
.Vision Technologies, Inc. is a small company that uses ultra-wideband technology to develop devices that can detect objects (including people) inside buildings, behind walls, or below ground. The company expects to spend $100,000 per year for labor and S125,000 per year for supplies before a product can be marketed. If the company wants to know the total equivalent future amount of the company's expenses at the end...
 Show math and procedure for each question for a positive
rating
.Vision Technologies, Inc. is a small company that uses ultra-wideband technology to develop devices that can detect objects (including people) inside buildings, behind walls, or below ground. The company expects to spend $100,000 per year for labor and S125,000 per year for supplies before a product can be marketed. If the company wants to know the total equivalent future amount of the company's expenses at the end of 3...
Show math and procedure for each question for a positive
rating
.Vision Technologies, Inc. is a small company that uses ultra-wideband technology to develop devices that can detect objects (including people) inside buildings, behind walls, or below ground. The company expects to spend $100,000 per year for labor and S125,000 per year for supplies before a product can be marketed. If the company wants to know the total equivalent future amount of the company's expenses at the end of 3...
 Construct a cash flow diagram for the following cash flows: $25,000 outflow at time 0, $9000 per year inflow in years 1 through 5 at an interest rate of 10% per year, and an unknown future amount in year 5. 4. If a company sets aside $1,000,000 now into a contingency fund, how much will the company have in 2 years, if it does not use any of the money and the account grows at a rate of 10% per...
 Please draw diagram and include formulas for positive
rating
One company is working on a new project. What is the present worth of the project if the annual cost (years 1 through 5) is $8 million per year? What would the equivalent amount be 6 years from now? Interest rte 10% per year. (Cash flow diagram + calculation)
Please draw diagram and include formulas for positive
rating
One company is working on a new project. What is the present worth of the project if the annual cost (years 1 through 5) is $8 million per year? What would the equivalent amount be 6 years from now? Interest rte 10% per year. (Cash flow diagram + calculation)
 please draw the cash flow diagram
Q2: A person invests 1000$ in the first year, 1500$ in the second year, 1800$ in the third year, 1200$ in the fourth year and 2000% in the fifth year. At an annual compound interest rate of 8%: 1. Calculate present worth (P). 2. Calculate future worth (F). Note: solve by either the equations or tables.
please draw the cash flow diagram
Q2: A person invests 1000$ in the first year, 1500$ in the second year, 1800$ in the third year, 1200$ in the fourth year and 2000% in the fifth year. At an annual compound interest rate of 8%: 1. Calculate present worth (P). 2. Calculate future worth (F). Note: solve by either the equations or tables.
 Problem (1): For the following table and interest rate of 10% per year End of Year Revenue (SR) Expenses (SR) 0 1 0 0 2000 200 2 500 200 3 600 200 4 700 0 5 800 0 6 1000 0 7 1000 0 8 1000 2000 1. Draw the Cash flow Diagram. 2. Calculate the equivalent Present worth (PW).
 80 Points Draw and solve the Cash Flow Diagram for Future Value “F12". The data below is a 10 year Cash Flow, and interest rate is a compounded 7%). Don't just use F/P and P/F. Use the best "tool” for each item below a. $10,000.00 is Invested Today for a piece of testing equipment b. $2000.00 is Earned as Annual Income from end of years 1-10 through use of this test equipment c. $400.00 is the Annual Maintenance Cost of...
 1. The unit cost of installing a solar power system per km² was $5,000 in 2010 when the construction cost index was 1,850. Construction of a 5 MW power system requires 50 km² of land. Estimate the cost of constructing a solar power system of 20 MW in 2020 given that the construction cost index is 2,450 and the size-factor is 0.75? 2. A company that manufactures general-purpose transducers invested $2 million four years ago in high-yield junk box bonds....
 please help..
Problem 1 For the following table (a) Draw the cash flow diagram Receipts Year 0 1 2 Disbursements $50,000 $15,000 $15,000 2 S5.000 System Initial Costs Produced Products Produced Products Preventive Maintance Produced Products Corrective Maintance Produced Products Preventive Maintance Produced Products Salvage value $15,000 $15,000 $15,000 $5,000 4 5 5 6 $15,000 $25,000 Problem 2 $1000 is deposited in a savinga account that pays 6% annual interest, and no money is withdrawn for three years. Most nearly,...
please help..
Problem 1 For the following table (a) Draw the cash flow diagram Receipts Year 0 1 2 Disbursements $50,000 $15,000 $15,000 2 S5.000 System Initial Costs Produced Products Produced Products Preventive Maintance Produced Products Corrective Maintance Produced Products Preventive Maintance Produced Products Salvage value $15,000 $15,000 $15,000 $5,000 4 5 5 6 $15,000 $25,000 Problem 2 $1000 is deposited in a savinga account that pays 6% annual interest, and no money is withdrawn for three years. Most nearly,...
 Please read the questions carefully. Please draw the cash flow diagrams and explain the steps that you are going to approach to solve the problems then solve the problem. Show the details in solving the problems. Please write legible hand writing, otherwise there is a deduction from your grade 10 points Missing Cash Flow Diagram is deductible points equal to 10% of the total points for each question. Question - 1 A series of equal semiannual cash flows starts with...
Most questions answered within 3 hours.
-
The extent to which assets are financed by borrowed funds and
other liabilities is indicated by:...
asked 7 minutes ago -
Explain in detail
Germany is the fifth largest economy
explain what goods and services Germany specializes...
asked 21 minutes ago -
The density of platinum is 21.45 g/mL. If a cube of platinum
with a mass of...
asked 27 minutes ago -
Accounts Receivable
Sales
A/R Posting
Extended Sales Invoice
Packing Slip
Compare invoice to packing slip 2...
asked 30 minutes ago -
Michaella, age 23, is a full-time law student and is claimed by
her parents as a...
asked 30 minutes ago -
Why are polymers not typically casted into products?
asked 47 minutes ago -
When rolling a die 129 times, what is the probability of rolling
a 6 no more...
asked 1 hour ago -
4. A call option currently sells for $7.75. It has a strike
price of $85 and...
asked 53 minutes ago -
1.
You need to prepare 10.0 liters of an acid aqueous solution with a
pH of...
asked 55 minutes ago -
Along an aggregate supply curve, if the level of output is less
than the natural level...
asked 56 minutes ago -
By 2025, annual consumption in emerging markets will total $30
trillion and contribute more than ________...
asked 1 hour ago -
At what point does reformation cease to be a viable option for
those who are oppressed...
asked 1 hour ago