
Homework Answers

Add Answer to:
Exercise 10-3 Algo Consider the following competing hypotheses and accompanying sample data drawn independently from normally...
Consider the following competing hypotheses and accompanying sample data drawn independently from normally distributed populations. (You...
Consider the following competing hypotheses and accompanying sample data drawn independently from normally distributed populations. (You may find it useful to reference the appropriate table: z table or t table) H0: μ1 − μ2 ≥ 0 HA: μ1 − μ2 < 0 x−1 x − 1 = 222 x−2 x − 2 = 253 s1 = 32 s2 = 26 n1 = 12 n2 = 12 a-1. Calculate the value of the test statistic under the assumption that the population...
Consider the following competing hypotheses and accompanying sample data drawn independently from normally distributed populations
 Consider the following competing hypotheses and accompanying sample data drawn independently from normally distributed populations. (You may find it useful to reference the appropriate table: ztable or ttable) a-1. Calculate the value of the test statistic. (Negative values should be indicated by a minus sign. Round all intermediate calculations to at least 4 decimal places and final answer to 2 decimal places.) Test statistic a-2. Find the p-value.a-3. Do you reject the null hypothesis at the 1% significance level? a-4. Interpret the results...
Consider the following competing hypotheses and accompanying sample data drawn independently from normally distributed populations. (You may find it useful to reference the appropriate table: z table or t table)
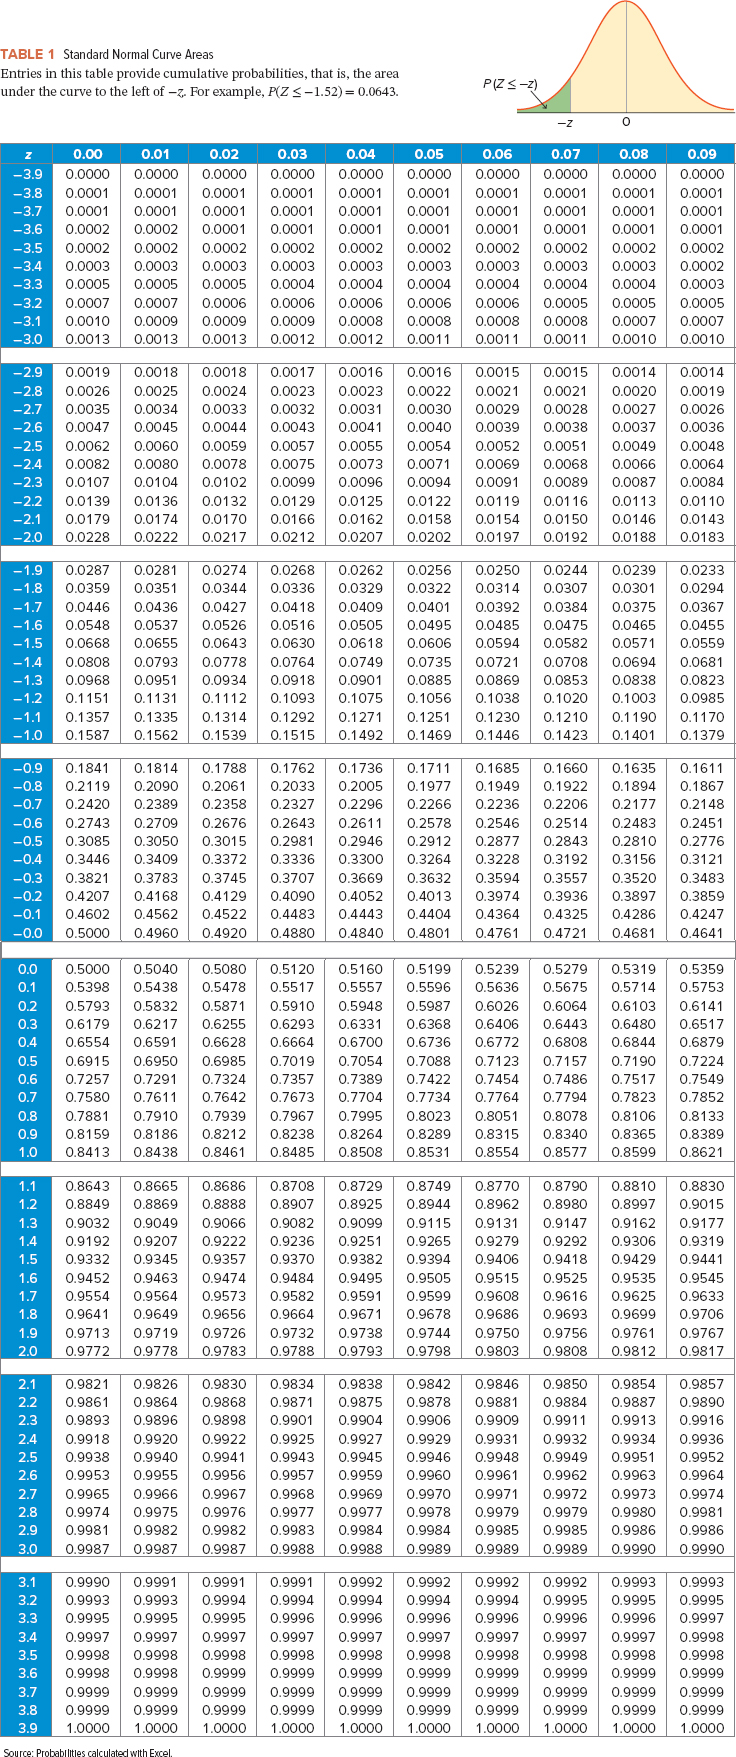 Consider the following competing hypotheses and accompanying sample data drawn independently from normally distributed populations. (You may find it useful to reference the appropriate table: z table or t table) H0: μ1 − μ2 = 0HA: μ1 − μ2 ≠ 0 x−1x−1 = 57x−2 = 63σ1 = 11.5σ2 = 15.2n1 = 20n2 = 20a-1. Calculate the value of the test statistic. (Negative values should be indicated by a minus sign. Round all intermediate calculations to at least 4 decimal places and final answer to 2 decimal places.)Test Statistic ?
Consider the following competing hypotheses and accompanying sample data drawn independently from normally distributed populations. (You...
 Consider the following competing hypotheses and accompanying sample data drawn independently from normally distributed populations. (You may find it useful to reference the appropriate table: z table or t table) Ho: H1-Hu2 0 HA: H1 Hz< e 251 252 s1 39 s=19 n1=7 n 7 a-1. Calculate the value of the test statistic under the assumption that the population variances are equal. (Negative values should be indicated by a minus sign. Round all intermediate calculations to at least 4 decimal...
Consider the following competing hypotheses and accompanying sample data drawn independently from normally distributed populations
 Consider the following competing hypotheses and accompanying sample data drawn independently from normally distributed populations. (You may find it useful to reference the appropriate table: z table or t table) a-1. Calculate the value of the test statistic.a-2. Find the p-value.a-3. Do you reject the null hypothesis at the 5% significance level? a-4. Interpret the results at α = 0.05.
Consider the following competing hypotheses and accompanying sample data drawn independently from normally distributed populations. (Note:...
Consider the following competing hypotheses and accompanying sample data drawn independently from normally distributed populations. (Note: the automated question following this one will ask you confidence interval questions for this same data, so jot down your work.) H0: μ1 − μ2 = 0 HA: μ1 − μ2 ≠ 0 x−1x−1 = 60 x−2x−2 = 56 σ1 = 1.62 σ2 = 10.20 n1 = 25 n2 = 25 Calculate the value of the test statistic. (Negative values should be indicated by...
Consider the following competing hypotheses and accompanying sample data drawn independently from normally distributed populations. (You may find it useful to reference the appropriate table: z table or t table)
 Consider the following competing hypotheses and accompanying sample data drawn independently from normally distributed populations. (You may find it useful to reference the appropriate table: z table or t table) H0: μ1 − μ2 ≥ 0HA: μ1 − μ2 < 0 x¯1x¯1= 249x−2x−2= 262s1 = 35s2 = 23n1 = 10n2 = 10a-1. Calculate the value of the test statistic under the assumption that the population variances are equal. (Negative values should be indicated by a minus sign. Round all intermediate calculations to at least 4 decimal places and final answer to 3 decimal places.) a-2. Find the p-value. multiple choice 1p-value < 0.010.01 ≤ p-value...
Consider the following competing hypotheses and accompanying sample data (You may find it useful to reference...
 Consider the following competing hypotheses and accompanying sample data (You may find it useful to reference the appropriate table: z table or t table) Ho: Pi - P22 MA: P1 - P2 @ X1 - 238 nu - 425 X2 - 263 n2 - 425 a. Calculate the value of the test statistic (Negative value should be indicated by a minus sign. Round intermediate calculations to at least 4 decimal places and final answer to 2 decimal places.) Test statistic...
Help Save &Exit Check Exercise 11-26 Algo Consider the following measures based on independently drawn samples...
 Help Save &Exit Check Exercise 11-26 Algo Consider the following measures based on independently drawn samples from normally distributed populations: (You may find it useful to reference the appropriate table: chi-square table or Ftable) Sample 1: s-279, and 16 Sample 2: s2 -167, and n2 11 a. Construct the 90% interval estimate for the ratio of the population variances. (Round "P value and final answers to 2 decimal places.) Confidence interval to b Using the confidence interval from Part (a),...
Exercise 11-29 Algo Consider the following competing hypotheses and relevant summary statistics: (You may find it...
 Exercise 11-29 Algo Consider the following competing hypotheses and relevant summary statistics: (You may find it useful to reference the appropriate table: chi-square table or F table) Ho: oſ /oz 21 HA: 01/03 <1 Sample 1: si = 1,391, and n1 = 14 Sample 2: s2 = 1,484, and n2 = 21 a. Calculate the value of the test statistic. (Round intermediate calculations to at least 4 decimal places and final answer to 3 decimal places.) Test statistic
 Consider the following competing hypotheses and accompanying sample data drawn independently from normally distributed populations. (You may find it useful to reference the appropriate table: z table or t table) Ho: H1-Hu2 0 HA: H1 Hz< e 251 252 s1 39 s=19 n1=7 n 7 a-1. Calculate the value of the test statistic under the assumption that the population variances are equal. (Negative values should be indicated by a minus sign. Round all intermediate calculations to at least 4 decimal...
 Consider the following competing hypotheses and accompanying sample data (You may find it useful to reference the appropriate table: z table or t table) Ho: Pi - P22 MA: P1 - P2 @ X1 - 238 nu - 425 X2 - 263 n2 - 425 a. Calculate the value of the test statistic (Negative value should be indicated by a minus sign. Round intermediate calculations to at least 4 decimal places and final answer to 2 decimal places.) Test statistic...
 Help Save &Exit Check Exercise 11-26 Algo Consider the following measures based on independently drawn samples from normally distributed populations: (You may find it useful to reference the appropriate table: chi-square table or Ftable) Sample 1: s-279, and 16 Sample 2: s2 -167, and n2 11 a. Construct the 90% interval estimate for the ratio of the population variances. (Round "P value and final answers to 2 decimal places.) Confidence interval to b Using the confidence interval from Part (a),...
 Exercise 11-29 Algo Consider the following competing hypotheses and relevant summary statistics: (You may find it useful to reference the appropriate table: chi-square table or F table) Ho: oſ /oz 21 HA: 01/03 <1 Sample 1: si = 1,391, and n1 = 14 Sample 2: s2 = 1,484, and n2 = 21 a. Calculate the value of the test statistic. (Round intermediate calculations to at least 4 decimal places and final answer to 3 decimal places.) Test statistic
Most questions answered within 3 hours.
-
A
runaway train car that has a mass of 1,400 kg travels at a speed of...
asked 18 seconds ago -
Two capacitors with capacitances of 12 and 18.1 µF,
respectively, are connected in parallel. The system...
asked 51 seconds ago -
Let's say you are a small business owner that provides
business-to-business software-as-a-service to non-profit
organizations. Your...
asked 5 minutes ago -
A circuit is constructed with five resistors and a battery as
shown. The battery voltage is...
asked 13 minutes ago -
A. What is the U.S.
economic system and what do you think are the advantages and...
asked 13 minutes ago -
A spherical surface completely surrounds a collection of
charges. Find the electric flux through the surface...
asked 14 minutes ago -
A student measures the following data in a calorimetry
experiment designed to determine the specific heat...
asked 28 minutes ago -
1) 2H2O(g) → 2H2 (g) + O2 (g) DH = 483.6 kJ
If 5 moles of...
asked 33 minutes ago -
Suppose that Alicia has $30,000 in invested as follows: $10,000
in TJX Cos., $15,000 in Macy’s,...
asked 48 minutes ago -
Volunteer Pharmaceuticals (VP) wants to set aside money in the
R&D fund to seek supplemental drug...
asked 48 minutes ago -
What is precedent?
an order by the court.
the power of a court to overrule a...
asked 54 minutes ago -
Classify the tonicity of a solution made by dissolving 12mg of
sodium chloride in 1.0mL of...
asked 1 hour ago