Consider the following competing hypotheses and accompanying sample data drawn independently from normally distributed populations
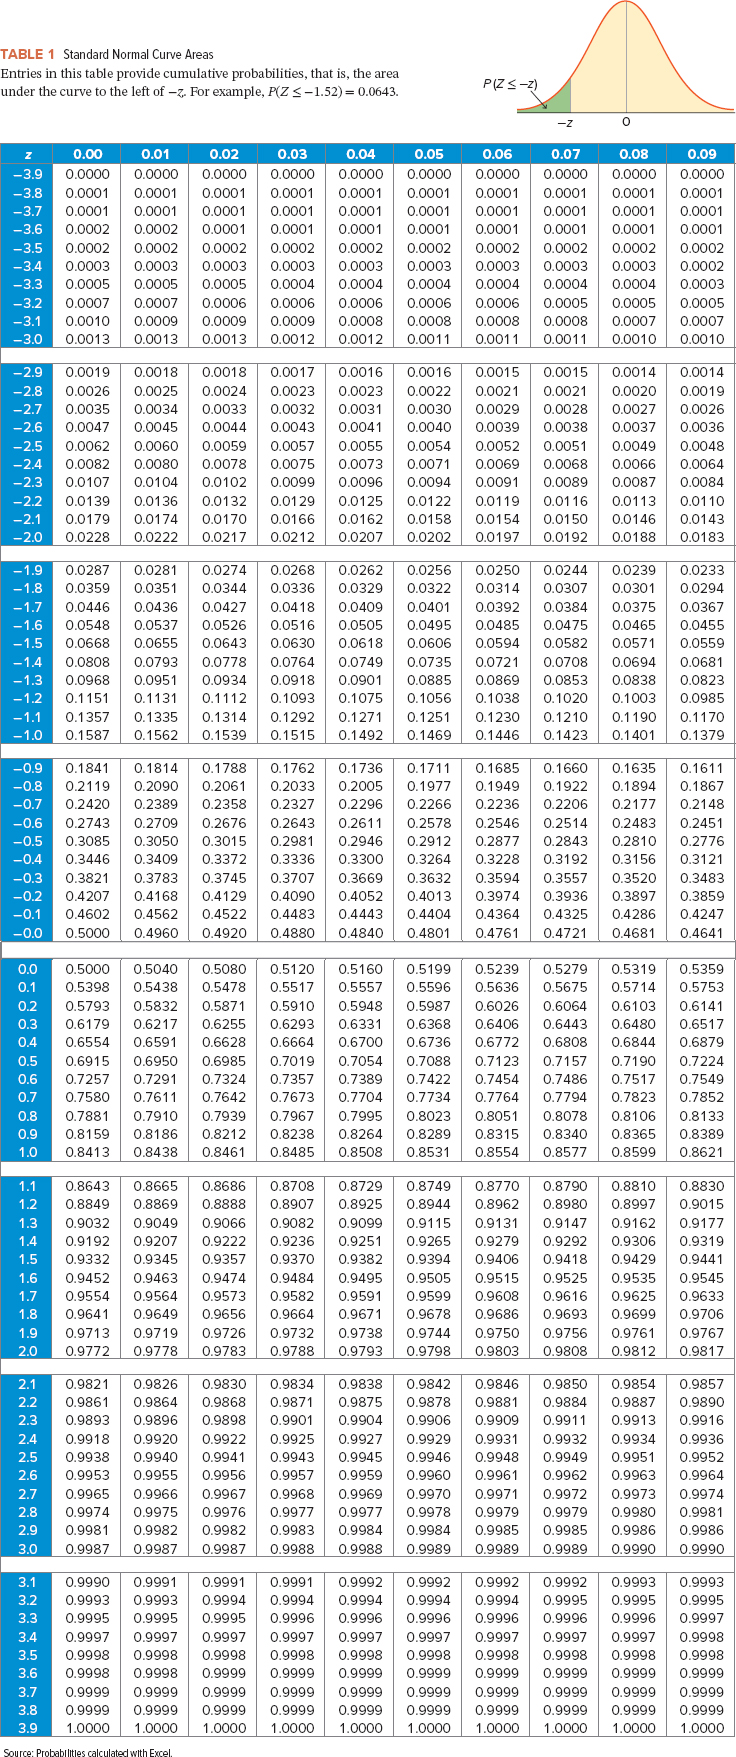
Consider the following competing hypotheses and accompanying sample data drawn independently from normally distributed populations. (You may find it useful to reference the appropriate table: ztable or ttable)

a-1. Calculate the value of the test statistic. (Negative values should be indicated by a minus sign. Round all intermediate calculations to at least 4 decimal places and final answer to 2 decimal places.) Test statistic
a-2. Find the p-value.
a-3. Do you reject the null hypothesis at the 1% significance level?
a-4. Interpret the results at α = 0.01
Homework Answers

Consider the following competing hypotheses and accompanying sample data drawn independently from normally distributed populations. (You may find it useful to reference the appropriate table: z table or t table)
H0: μ1 − μ2 = 0
HA: μ1 − μ2 ≠ 0
| σ1 = 11.5 | σ2 = 15.2 |
| n1 = 20 | n2 = 20 |
a-1. Calculate the value of the test statistic. (Negative values should be indicated by a minus sign. Round all intermediate calculations to at least 4 decimal places and final answer to 2 decimal places.)
Add Answer to:
Consider the following competing hypotheses and accompanying sample data drawn independently from normally distributed populations
Consider the following competing hypotheses and accompanying sample data drawn independently from normally distributed populations
 Consider the following competing hypotheses and accompanying sample data drawn independently from normally distributed populations. (You may find it useful to reference the appropriate table: z table or t table) a-1. Calculate the value of the test statistic.a-2. Find the p-value.a-3. Do you reject the null hypothesis at the 5% significance level? a-4. Interpret the results at α = 0.05.
Consider the following competing hypotheses and accompanying sample data drawn independently from normally distributed populations. (You...
 Consider the following competing hypotheses and accompanying sample data drawn independently from normally distributed populations. (You may find it useful to reference the appropriate table: z table or t table) Ho: H1-Hu2 0 HA: H1 Hz< e 251 252 s1 39 s=19 n1=7 n 7 a-1. Calculate the value of the test statistic under the assumption that the population variances are equal. (Negative values should be indicated by a minus sign. Round all intermediate calculations to at least 4 decimal...
Consider the following competing hypotheses and accompanying sample data drawn independently from normally distributed populations. (You...
Consider the following competing hypotheses and accompanying sample data drawn independently from normally distributed populations. (You may find it useful to reference the appropriate table: z table or t table) H0: μ1 − μ2 ≥ 0 HA: μ1 − μ2 < 0 x−1 x − 1 = 222 x−2 x − 2 = 253 s1 = 32 s2 = 26 n1 = 12 n2 = 12 a-1. Calculate the value of the test statistic under the assumption that the population...
Consider the following competing hypotheses and accompanying sample data drawn independently from normally distributed populations. (Note:...
Consider the following competing hypotheses and accompanying sample data drawn independently from normally distributed populations. (Note: the automated question following this one will ask you confidence interval questions for this same data, so jot down your work.) H0: μ1 − μ2 = 0 HA: μ1 − μ2 ≠ 0 x−1x−1 = 60 x−2x−2 = 56 σ1 = 1.62 σ2 = 10.20 n1 = 25 n2 = 25 Calculate the value of the test statistic. (Negative values should be indicated by...
Consider the following competing hypotheses and accompanying sample data drawn independently from normally distributed populations. (You may find it useful to reference the appropriate table: z table or t table)
 Consider the following competing hypotheses and accompanying sample data drawn independently from normally distributed populations. (You may find it useful to reference the appropriate table: z table or t table) H0: μ1 − μ2 ≥ 0HA: μ1 − μ2 < 0 x¯1x¯1= 249x−2x−2= 262s1 = 35s2 = 23n1 = 10n2 = 10a-1. Calculate the value of the test statistic under the assumption that the population variances are equal. (Negative values should be indicated by a minus sign. Round all intermediate calculations to at least 4 decimal places and final answer to 3 decimal places.) a-2. Find the p-value. multiple choice 1p-value < 0.010.01 ≤ p-value...
Consider the following competing hypotheses and accompanying sample data drawn independently from normally distributed populations. (You may find it useful to reference the appropriate table: z table or t table)
 Consider the following competing hypotheses and accompanying sample data drawn independently from normally distributed populations. (You may find it useful to reference the appropriate table: z table or t table) H0: μ1 − μ2 = 0HA: μ1 − μ2 ≠ 0 x−1x−1 = 57x−2 = 63σ1 = 11.5σ2 = 15.2n1 = 20n2 = 20a-1. Calculate the value of the test statistic. (Negative values should be indicated by a minus sign. Round all intermediate calculations to at least 4 decimal places and final answer to 2 decimal places.)Test Statistic ?
Exercise 10-3 Algo Consider the following competing hypotheses and accompanying sample data drawn independently from normally...
 Exercise 10-3 Algo Consider the following competing hypotheses and accompanying sample data drawn independently from normally distributed populations ay find it useful to reference the appropriate table: z table or t table) He//H1AZ 75 279 01-11.10 σ2-1.67 n1/20 o-1. Calculate the value of the test statistic. (Negative values should be indicated by a minus sign. Round all intermediate celculations to at least 4 decimal places and final answer to 2 decimal places.) 005 s pvalue s0.10o 0.025 s pvalue c0.05...
Consider the following competing hypotheses and accompanying sample data. (You may find it useful to reference...
 Consider the following competing hypotheses and accompanying sample data. (You may find it useful to reference the a table: z table or ttable) He: P1 - P2 = 0.20 HA: P1 - P20.20 25 points *1 = 126 y = 243 X2 = 125 = 480 8 03.06.08 a. Calculate the value of the test statistic. (Round Intermediate calculations to at least 4 decimal places and final answer decimal places.) eBook Test statistic References b. Find the p-value. 0.01 s...
Consider the following sample data drawn independently from normally distributed populations with equal population variances. Use...
 Consider the following sample data drawn independently from normally distributed populations with equal population variances. Use Table 2. Sample 1 12.7 11.7 7.8 11.6 10.8 10.4 94 10.7 Sample 2 8.7 10.8 13.5 11.8 11.5 95 10.8 11.8 Click here for the Excel Data File a. Construct the relevant hypotheses to test if the mean of the second population is greater than the mean of the first population. O Ho: Ni - M2 = 0; HAV1 -20 O Ho: Mi...
Consider the following competing hypotheses and accompanying sample data. (You may find it useful to reference...
Consider the following competing hypotheses and accompanying sample data. (You may find it useful to reference the appropriate table: z table or t table) H0: p1 − p2 ≥ 0 HA: p1 − p2 < 0 x1 = 250 x2 = 275 n1 = 400 n2 = 400 a. Calculate the value of the test statistic. (Negative value should be indicated by a minus sign. Round intermediate calculations to at least 4 decimal places and final answer to 2 decimal...
 Consider the following competing hypotheses and accompanying sample data drawn independently from normally distributed populations. (You may find it useful to reference the appropriate table: z table or t table) Ho: H1-Hu2 0 HA: H1 Hz< e 251 252 s1 39 s=19 n1=7 n 7 a-1. Calculate the value of the test statistic under the assumption that the population variances are equal. (Negative values should be indicated by a minus sign. Round all intermediate calculations to at least 4 decimal...
 Exercise 10-3 Algo Consider the following competing hypotheses and accompanying sample data drawn independently from normally distributed populations ay find it useful to reference the appropriate table: z table or t table) He//H1AZ 75 279 01-11.10 σ2-1.67 n1/20 o-1. Calculate the value of the test statistic. (Negative values should be indicated by a minus sign. Round all intermediate celculations to at least 4 decimal places and final answer to 2 decimal places.) 005 s pvalue s0.10o 0.025 s pvalue c0.05...
 Consider the following competing hypotheses and accompanying sample data. (You may find it useful to reference the a table: z table or ttable) He: P1 - P2 = 0.20 HA: P1 - P20.20 25 points *1 = 126 y = 243 X2 = 125 = 480 8 03.06.08 a. Calculate the value of the test statistic. (Round Intermediate calculations to at least 4 decimal places and final answer decimal places.) eBook Test statistic References b. Find the p-value. 0.01 s...
 Consider the following sample data drawn independently from normally distributed populations with equal population variances. Use Table 2. Sample 1 12.7 11.7 7.8 11.6 10.8 10.4 94 10.7 Sample 2 8.7 10.8 13.5 11.8 11.5 95 10.8 11.8 Click here for the Excel Data File a. Construct the relevant hypotheses to test if the mean of the second population is greater than the mean of the first population. O Ho: Ni - M2 = 0; HAV1 -20 O Ho: Mi...
Most questions answered within 3 hours.
-
Do not neglect the old for the new. The existing business must
not lose priority simply...
asked 1 hour ago -
Kylie is a single mom with two dependent children,
Tanner, age 7 and Olivia, age 11....
asked 3 hours ago -
Phosphorous + bromine = phosphorous tribromide. If 35.0 g of
bromine are reacted and 27.9 grams...
asked 4 hours ago -
Derive the long wavelength limit of the Planck energy density
distribution
asked 4 hours ago -
Calculate the pH of each of the following solutions.
0.50 M HBr
3.1×10⁻⁴ M KOH
4.2×10⁻⁵...
asked 8 hours ago -
For the year ended December 31, Depot Max’s cost of merchandise
sold was $85,600. Inventory at the...
asked 8 hours ago -
Week 10 - Professional Memo Assignment
Professional Memo Assignment
Your mission for this week, should you...
asked 8 hours ago -
Write a Python program that stores the data for each
player on the team, and it...
asked 8 hours ago -
In
the last 3 months, mike never knows when he is going to get his
allowance...
asked 8 hours ago -
Is Ca(OH)2 a Bronsted base, Lewis base, or both? Why?
asked 8 hours ago -
1A- Why don’t voters complain about U.S. tariffs on imported
sugar?
Because sugar is only a...
asked 8 hours ago -
Cash Payback Period
Primera Banco is evaluating two capital investment proposals for
a drive-up ATM kiosk,...
asked 8 hours ago