The grades of a class of 9 students on a midterm report (x) and on the...
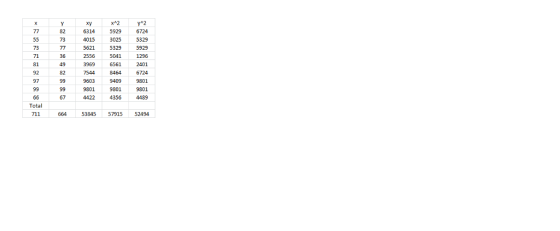
The grades of a class of 9 students on a midterm report (x) and on the final examination (y) are shown below. Use the data to complete parts (a) and (b).
(a) Estimate the linear regression line.
x 77 55 73 71 81 92 97 99 66
y 82 73 77 36 49 82 99 99 67
Homework Answers
Here to estimate the regression equation find the regression coefficient (b yx)

Add Answer to:
The grades of a class of 9 students on a midterm report (x) and
on the...
The grades of a class of 9 students on a midterm report (x) and on the...
 The grades of a class of 9 students on a midterm report (x) and on the final examination (y) are shown below. Use the data to complete parts (a) and (b). x 75 55 72 71 82 94 96 99 68 D y 80 73 78 36 48 84 99 99 70 (a) Estimate the linear regression line. 9=0.0* (Round the constant to one decimal place as needed. Round the coefficient to three decimal places as needed.) (b) Estimate the...
3 JU The grades of a class of 9 students on a midterm report (x) and...
 3 JU The grades of a class of 9 students on a midterm report (x) and on the final examination () are as follows 67 99 96 94 81 72 71 50 77 68 99 99 85 47 34 78 66 82 x=85. Compute a 95% confidence interval for the mean response Hy/x when
statistic
The grades of a class of 9 students on a midterm report (x) and on the final examination (y) are as followsx = 77 50 71 72 81 94 96 99 67 y = 82 66 78 34 47 85 99 99 68(a) Estimate the linear regression line. (b) Estimate the final examination grade of a student who received a grade of 85 on the midterm report
The given data is the grades for people in this class. The goal here is to...
 The given data is the grades for people in this class. The goal here is to determine the factors that effect student's Grade in the class. 4) Find the mean and median for the men's and the women's Quizzes. Gender Men Women 5) Test the claim that the majority of students at this class are women. F M F F M F F F F M M F F F M F F F F M M F F M...
Student stress at final exam time comes partly from the uncertainty of grades and the consequence...
 Student stress at final exam time comes partly from the
uncertainty of grades and the consequences of those grades. Can
knowledge of a midterm grade be used to predict a final exam grade?
A random sample of 200 BCOM students from recent years was taken
and their percentage grades on assignments, midterm exam, and final
exam were recorded. Let’s examine the ability of midterm and
assignment grades to predict final exam grades.
The data are shown here:
Assignment
Midterm
FinalExam...
Student stress at final exam time comes partly from the
uncertainty of grades and the consequences of those grades. Can
knowledge of a midterm grade be used to predict a final exam grade?
A random sample of 200 BCOM students from recent years was taken
and their percentage grades on assignments, midterm exam, and final
exam were recorded. Let’s examine the ability of midterm and
assignment grades to predict final exam grades.
The data are shown here:
Assignment
Midterm
FinalExam...
Consider the below matrixA, which you can copy and paste directly into Matlab.
Problem #1: Consider the below matrix A, which you can copy and paste directly into Matlab. The matrix contains 3 columns. The first column consists of Test #1 marks, the second column is Test # 2 marks, and the third column is final exam marks for a large linear algebra course. Each row represents a particular student.A = [36 45 75 81 59 73 77 73 73 65 72 78 65 55 83 73 57 78 84 31 60 83...
Question 1 15 pts Test scores for a class of 40 students are listed below: 25...
 Question 1 15 pts Test scores for a class of 40 students are listed below: 25 35 43 44 47 48 54 55 56 57 59 62 63 65 66 68 69 69 71 72 72 73 74 76 77 77 78 79 80 81 81 82 83 85 89 92 93 94 97 98 a) The mean of the sample data is b) The median of the sample data is c) The standard deviation of the sample data is...
Boats (tens of thousands) Manatees x y 65 53 71 36 67 35 69 48 74...
 Boats (tens of thousands) Manatees
x y
65 53
71 36
67 35
69 48
74 44
74 58
75 55
82 65
84 81
81 80
89 80
89 94
97 72
93 67
99 77
98 92
97 71
100 92
92 97
93 81
88 90
87 82
92 71
92 66
Use the accompanying paired data conslisting of registered boats (tens of thousands) and manatee fatalities from boat enccunters. Let x represent the number of registered...
Boats (tens of thousands) Manatees
x y
65 53
71 36
67 35
69 48
74 44
74 58
75 55
82 65
84 81
81 80
89 80
89 94
97 72
93 67
99 77
98 92
97 71
100 92
92 97
93 81
88 90
87 82
92 71
92 66
Use the accompanying paired data conslisting of registered boats (tens of thousands) and manatee fatalities from boat enccunters. Let x represent the number of registered...
A random sample of 9 history students produced the following data, first test score, x second...
A random sample of 9 history students produced the following data, first test score, x second test score, y 90 51 36 82 13 15 71 77 82 10 20 18 92 35 53 49 63 85 where x measures the first test score and y measures the second test score. What is the estimate of the y = a x + b regression slope coefficient?
2. (1.18) The following scores represent the final examination grades for an elementary statistics course: 33...
 2. (1.18) The following scores represent the final examination grades for an elementary statistics course: 33 60 79 32 57 74 52 70 82 36 80 77 81 95 41 65 92 85 55 76 52 30 64 75 78 35 80 98 81 67 a) Construct a Stem-and-Leaf Plot for the examination grades. b) Construct a Relative Frequency Histogram with 6 Class Intervals (that is: 6 rectangles) c) Compute the Sample Median Median. ) What is the Sample Mode?
 The grades of a class of 9 students on a midterm report (x) and on the final examination (y) are shown below. Use the data to complete parts (a) and (b). x 75 55 72 71 82 94 96 99 68 D y 80 73 78 36 48 84 99 99 70 (a) Estimate the linear regression line. 9=0.0* (Round the constant to one decimal place as needed. Round the coefficient to three decimal places as needed.) (b) Estimate the...
 3 JU The grades of a class of 9 students on a midterm report (x) and on the final examination () are as follows 67 99 96 94 81 72 71 50 77 68 99 99 85 47 34 78 66 82 x=85. Compute a 95% confidence interval for the mean response Hy/x when
 The given data is the grades for people in this class. The goal here is to determine the factors that effect student's Grade in the class. 4) Find the mean and median for the men's and the women's Quizzes. Gender Men Women 5) Test the claim that the majority of students at this class are women. F M F F M F F F F M M F F F M F F F F M M F F M...
 Student stress at final exam time comes partly from the
uncertainty of grades and the consequences of those grades. Can
knowledge of a midterm grade be used to predict a final exam grade?
A random sample of 200 BCOM students from recent years was taken
and their percentage grades on assignments, midterm exam, and final
exam were recorded. Let’s examine the ability of midterm and
assignment grades to predict final exam grades.
The data are shown here:
Assignment
Midterm
FinalExam...
Student stress at final exam time comes partly from the
uncertainty of grades and the consequences of those grades. Can
knowledge of a midterm grade be used to predict a final exam grade?
A random sample of 200 BCOM students from recent years was taken
and their percentage grades on assignments, midterm exam, and final
exam were recorded. Let’s examine the ability of midterm and
assignment grades to predict final exam grades.
The data are shown here:
Assignment
Midterm
FinalExam...
 Question 1 15 pts Test scores for a class of 40 students are listed below: 25 35 43 44 47 48 54 55 56 57 59 62 63 65 66 68 69 69 71 72 72 73 74 76 77 77 78 79 80 81 81 82 83 85 89 92 93 94 97 98 a) The mean of the sample data is b) The median of the sample data is c) The standard deviation of the sample data is...
 Boats (tens of thousands) Manatees
x y
65 53
71 36
67 35
69 48
74 44
74 58
75 55
82 65
84 81
81 80
89 80
89 94
97 72
93 67
99 77
98 92
97 71
100 92
92 97
93 81
88 90
87 82
92 71
92 66
Use the accompanying paired data conslisting of registered boats (tens of thousands) and manatee fatalities from boat enccunters. Let x represent the number of registered...
Boats (tens of thousands) Manatees
x y
65 53
71 36
67 35
69 48
74 44
74 58
75 55
82 65
84 81
81 80
89 80
89 94
97 72
93 67
99 77
98 92
97 71
100 92
92 97
93 81
88 90
87 82
92 71
92 66
Use the accompanying paired data conslisting of registered boats (tens of thousands) and manatee fatalities from boat enccunters. Let x represent the number of registered...
 2. (1.18) The following scores represent the final examination grades for an elementary statistics course: 33 60 79 32 57 74 52 70 82 36 80 77 81 95 41 65 92 85 55 76 52 30 64 75 78 35 80 98 81 67 a) Construct a Stem-and-Leaf Plot for the examination grades. b) Construct a Relative Frequency Histogram with 6 Class Intervals (that is: 6 rectangles) c) Compute the Sample Median Median. ) What is the Sample Mode?
Most questions answered within 3 hours.
-
In the following reaction, which element is undergoing
oxidation: Na2SO3 + N2O --> N2 + Na2SO4...
asked 12 minutes ago -
Which of the following pairs of ions have the same electron
configuration?
I: Br− and Se2−...
asked 2 hours ago -
The Foremost Composite Materials Company is planning a two-day
sales conference for October 19-20. The conference...
asked 3 hours ago -
3) Illustrate the observed pattern of relatedness of organisms
versus adaptations to specific conditions. This means...
asked 3 hours ago -
In winter a lake has a 0.35 m thick ice layer over 1.10 m of
water....
asked 4 hours ago -
Assuming the following has been encrypted with a Vigenere cipher
below, use the method(s) and assumptions...
asked 4 hours ago -
How would I use switch statements to write a program that will
take an input of...
asked 4 hours ago -
Imagine a reaction in which methane gas combusts at a constant
pressure of 1 atm and...
asked 4 hours ago -
Two parallel wires (each 12 m in length) are separated by a
distance of 0.065 m...
asked 4 hours ago -
Suppose there were three masses at the corner of uniform
equilateral triangle. The masses are m1...
asked 4 hours ago -
Situation: A building that is 618 m above the ground floor. How
many times would a...
asked 4 hours ago -
help me and discuss one successful and one
unsuccessful international company/busines in Indonesia.whyit
succeed and why...
asked 5 hours ago