Analysis and Interpretation of Profitability Balance sheets and income statements for 3M Company follow. Consolidated Statements...
Analysis and Interpretation of Profitability
Balance sheets and income statements for 3M Company follow.
| Consolidated Statements of Income | |||
|---|---|---|---|
| Years ended December 31 ($ millions) | 2006 | 2005 | 2004 |
| Net sales | $22,923 | $ 21,167 | $ 20,011 |
| Operating expenses | |||
| Cost of sales | 11,713 | 10,408 | 10,002 |
| Selling, general and administrative expenses | 5,066 | 4,631 | 4,437 |
| Research, development and related expenses | 1,522 | 1,274 | 1,246 |
| Loss/(gain) from sale of business | (1,074) | -- | -- |
| Total operating expenses | 17,227 | 16,313 | 15,685 |
| Operating income | 5,696 | 4,854 | 4,326 |
| Interest expenses and income | |||
| Interest expense | 122 | 82 | 69 |
| Interest income | (51) | (56) | (46) |
| Total interest expense | 71 | 26 | 23 |
| Income before income taxes | 5,625 | 4,828 | 4,303 |
| Provision for income taxes | 1,723 | 1,627 | 1,400 |
| Net income including noncontrolling interest | 3,902 | 3,201 | 2,903 |
| Less: Net income attributable to noncontrolling interest | 51 | 55 | 62 |
| Net income | $ 3,851 | $ 3,146 | $ 2,841 |
| Consolidated Balance Sheets | ||
|---|---|---|
| ($ millions) | 2006 | 2005 |
| Assets | ||
| Current Assets | ||
| Cash and cash equivalents | $ 1,447 | $ 1,072 |
| Marketable securities-current | 471 | -- |
| Accounts receivable-net | 3,102 | 2,838 |
| Inventories | ||
| Finished goods | 1,235 | 1,050 |
| Work in process | 795 | 706 |
| Raw materials and supplies | 571 | 406 |
| Total inventories | 2,601 | 2,162 |
| Other current assets | 1,325 | 1,043 |
| Total current assets | 8,946 | 7,115 |
| Marketable securities-noncurrent | 166 | -- |
| Investments | 314 | 272 |
| Property, plant and equipment | 17,017 | 16,127 |
| Less: Accumulated depreciation | (11,110) | (10,534) |
| Property, plant and equipment-net | 5,907 | 5,593 |
| Goodwill | 4,082 | 3,530 |
| Intangible assets-net | 708 | 486 |
| Prepaid pension benefits | 395 | 2,905 |
| Other assets | 776 | 640 |
| Total assets | $ 21,294 | $ 20,541 |
| Liabilities | ||
| Current liabilities | ||
| Short-term borrowings and current portion of long-term debt | $ 2,506 | $ 1,072 |
| Accounts payable | 1,402 | 1,256 |
| Accrued payroll | 520 | 469 |
| Accrued income taxes | 1,134 | 989 |
| Other current liabilities | 1,761 | 1,452 |
| Total current liabilities | 7,323 | 5,238 |
| Long-term debt | 1,047 | 1,309 |
| Pension and postretirement benefits | -- | -- |
| Other liabilities | 2,965 | 3,599 |
| Total liabilities | 11,335 | 10,146 |
| Equity | ||
| 3M Company shareholders' equity: Common stock, par value $.01 per share; | 9 | 9 |
| Additional paid-in capital | 2,484 | 2,225 |
| Retained earnings | 17,933 | 15,715 |
| Treasury stock | (8,456) | (6,965) |
| Accumulated other comprehensive income (loss) | (2,011) | (589) |
| Total 3M Company shareholders' equity | 9,959 | 10,395 |
| Noncontrolling interest | - | - |
| Total equity | 9,959 | 10,395 |
| Total liabilities and equity | $ 21,294 | $ 20,541 |
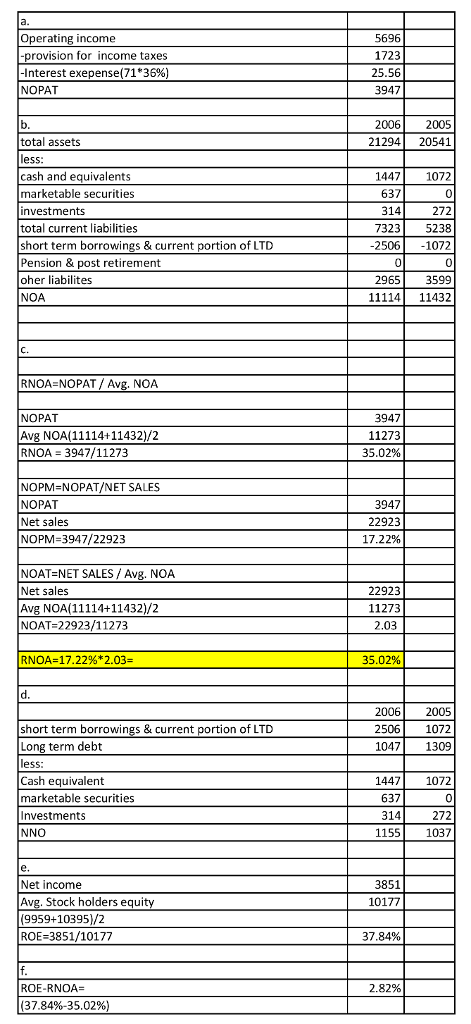
(a) Compute net operating profit after tax (NOPAT) for 2006. Assume
that the combined federal and statutory rate is: 36.0% (Round your
answer to the nearest whole number.)
2006 NOPAT =Answer ($ millions)
(b) Compute net operating assets (NOA) for 2006 and 2005. Treat
noncurrent Investments as a nonoperating item.
2006 NOA =Answer ($ millions)
2005 NOA =Answer ($ millions)
(c) Compute 3M's RNOA, net operating profit margin (NOPM) and net
operating asset turnover (NOAT) for 2006. (Round your answers to
two decimal places. Do not round until your final answer. Do not
use NOPM x NOAT to calculate RNOA.)
2006 RNOA = Answer %
2006 NOPM = Answer %
2006 NOAT =Answer
(f) What is the nonoperating return component of ROE for 2006?
(Round your answers to two decimal places.)
2006 nonoperating return = Answer%
Homework Answers
Add Answer to:
Analysis and Interpretation of Profitability
Balance sheets and income statements for 3M Company follow.
Consolidated Statements...
Analysis and Interpretation of Profitability Balance sheets and income statements for 3M Company follow. Consolidated Statements...
Analysis and Interpretation of Profitability Balance sheets and income statements for 3M Company follow. Consolidated Statements of Income Years ended December 31 ($ millions) 2007 2006 2005 Net sales $24,462 $22,923 $21,167 Operating expenses Cost of sales 12,735 11,713 10,408 Selling, general and administrative expenses 5,015 5,066 4,631 Research, development and related expenses 1,368 1,522 1,274 Loss/(gain) from sale of business (849) (1,074) -- Total operating expenses 18,269 17,227 16,313 Operating income 6,193 5,696 4,854 Interest expenses and income Interest...
Analysis and Interpretation of Profitability Balance sheets and income statements for 3M Company follow. Consolidated Statements...
 Analysis and Interpretation of Profitability Balance sheets and income statements for 3M Company follow. Consolidated Statements of Income Years ended December 31 ($ millions) 2007 2006 2005 Net sales $24,462 $22,923 $21,167 Operating expenses Cost of sales 12,735 11,713 10,408 Selling, general and administrative expenses 5,015 5,066 4,631 Research, development and related expenses 1,368 1,522 1,274 Loss/(gain) from sale of business (849) (1,074) Total operating expenses 18,269 17.227 16,313 Operating income 6,193 5,696 4,854 Interest expenses and income Interest expense...
Analysis and Interpretation of Profitability Balance sheets and income statements for 3M Company follow. Consolidated Statements...
 Analysis and Interpretation of Profitability Balance sheets and income statements for 3M Company follow. Consolidated Statements of Income Years ended December 31 ($ millions), 2007 2006 2005 Net sales $24,462 $22,923 $21,167 Operating expenses Cost of sales 12,735 11,713 10,408 Selling, general and administrative expenses 5,015 5,066 4,631 Research, development and related expenses 1,368 1,522 1,274 Loss/(gain) from sale of business (849) (1,074) Total operating expenses 18,269 17,227 16,313 Operating income 6,193 5,696 4,854 Interest expenses and income Interest expense...
Analysis and Interpretation of Profitability Balance sheets and income statements for 3M Company follow. Consolidated Statements...
Analysis and Interpretation of Profitability Balance sheets and income statements for 3M Company follow. Consolidated Statements of Income Years ended December 31 ($ millions) 2012 2011 2010 Net sales $29,904 $ 29,611 $ 226,662 Operating expenses Cost of sales 15,685 15,693 13,831 Selling, general and administrative expenses 6,102 6,170 5,479 Research, development and related expenses 1,634 1,570 1,434 -- -- -- Total operating expenses 23,421 23,433 20,744 Operating income 6,483 6,178 5,918 Interest expenses and income Interest expense 171 186...
Analysis and Interpretation of Profitability Balance sheets and income statements for 3M Company follow. Consolidated Statements...
Analysis and Interpretation of Profitability Balance sheets and income statements for 3M Company follow. Consolidated Statements of Income Years ended December 31 ($ millions) 2010 2009 2008 Net sales $26,662 $23,123 $25,269 Operating expenses Cost of sales 13,831 12,109 13,379 Selling, general and administrative expenses 5,479 4,907 5,245 Research, development and related expenses 1,434 1,293 1,404 Loss/(gain) from sale of business -- -- 23 Total operating expenses 20,744 18,309 20,051 Operating income 5,918 4,814 5,218 Interest expenses and income Interest...
Analysis and Interpretation of Profitability Balance sheets and income statements for 3M Company follow. 3M COMPANY...
 Analysis and Interpretation of Profitability Balance sheets and income statements for 3M Company follow. 3M COMPANY Consolidated Statements of Income For Years ended December 31 (5 millions) 2018 2017 Net sales $32,765 $31,657 Operating expenses Cost of sales 16,682 16,055 Selling, general and administrative expenses 7,602 6,626 Research, development and related expenses 1,821 1,870 Gain on sale of businesses (547) Total operating expenses 25,558 23,965 Operating income 7,207 7,692 Other expense, net* 207 144 Income before income taxes 7,000 7,548...
Analysis and Interpretation of Profitability Balance sheets and income statements for 3M Company follow. Consolidated Statements...
Analysis and Interpretation of Profitability Balance sheets and income statements for 3M Company follow. Consolidated Statements of Income Years ended December 31 ($ millions) 2010 2009 2008 Net sales $26,662 $23,123 $25,269 Operating expenses Cost of sales 13,831 12,109 13,379 Selling, general and administrative expenses 5,479 4,907 5,245 Research, development and related expenses 1,434 1,293 1,404 Loss/(gain) from sale of business -- -- 23 Total operating expenses 20,744 18,309 20,051 Operating income 5,918 4,814 5,218 Interest expenses and income Interest...
Analysis and Interpretation of Profitability Balance sheets and income statements for 3M Company follow. Consolidated Statements...
Analysis and Interpretation of Profitability Balance sheets and income statements for 3M Company follow. Consolidated Statements of Income Years ended December 31 ($ millions) 2009 2008 2007 Net sales $23,123 $25,269 $24,462 Operating expenses Cost of sales 12,109 13,379 12,735 Selling, general and administrative expenses 4,907 5,245 5,015 Research, development and related expenses 1,293 1,404 1,368 Loss/(gain) from sale of business -- 23 (849) Total operating expenses 18,309 20,051 18,269 Operating income 4,814 5,218 6,193 Interest expenses and income Interest...
 Analysis and Interpretation of Profitability Balance sheets and income statements for 3M Company follow. Consolidated Statements of Income Years ended December 31 ($ millions) 2007 2006 2005 Net sales $24,462 $22,923 $21,167 Operating expenses Cost of sales 12,735 11,713 10,408 Selling, general and administrative expenses 5,015 5,066 4,631 Research, development and related expenses 1,368 1,522 1,274 Loss/(gain) from sale of business (849) (1,074) Total operating expenses 18,269 17.227 16,313 Operating income 6,193 5,696 4,854 Interest expenses and income Interest expense...
 Analysis and Interpretation of Profitability Balance sheets and income statements for 3M Company follow. Consolidated Statements of Income Years ended December 31 ($ millions), 2007 2006 2005 Net sales $24,462 $22,923 $21,167 Operating expenses Cost of sales 12,735 11,713 10,408 Selling, general and administrative expenses 5,015 5,066 4,631 Research, development and related expenses 1,368 1,522 1,274 Loss/(gain) from sale of business (849) (1,074) Total operating expenses 18,269 17,227 16,313 Operating income 6,193 5,696 4,854 Interest expenses and income Interest expense...
 Analysis and Interpretation of Profitability Balance sheets and income statements for 3M Company follow. 3M COMPANY Consolidated Statements of Income For Years ended December 31 (5 millions) 2018 2017 Net sales $32,765 $31,657 Operating expenses Cost of sales 16,682 16,055 Selling, general and administrative expenses 7,602 6,626 Research, development and related expenses 1,821 1,870 Gain on sale of businesses (547) Total operating expenses 25,558 23,965 Operating income 7,207 7,692 Other expense, net* 207 144 Income before income taxes 7,000 7,548...
Most questions answered within 3 hours.
-
a) The frequency of light coming out from a laser source is 297
MHz. What is...
asked 10 minutes ago -
LABORATORY EXERCISES:
Using nested for loops, write a java program to print the
pattern as shown...
asked 9 minutes ago -
Assume that the correlation coefficient between achievement test
scores (X) and grade point averages (Y) among...
asked 22 minutes ago -
In Chapter 1 titled "So Close and Yet So Different", in "Why
Nations Fail" authors bring...
asked 19 minutes ago -
Leadership Philosophy
Write a two-page paper identifying your personal leadership
philosophy based on your new perspective...
asked 16 minutes ago -
Which of these function correctly defines the function g(),
which should return a pointer to a...
asked 25 minutes ago -
Pickett Industries just paid a dividend of D0 = $1.10. Analysts
expect the company's dividend to...
asked 25 minutes ago -
Suppose a random sample of 900 measurements is taken from an
unknown population. The average of...
asked 28 minutes ago -
Suppose we add another SRC instruction xor ra, rb, rc that xors
the contents of registers...
asked 29 minutes ago -
Hello, I need some help creating this class in Java. This is for
a larger project....
asked 51 minutes ago -
Why does entrepreneurs trying to employ AI into their
business organizations? What are the advantages and...
asked 48 minutes ago -
// This program is supposed to display every fifth year
// starting with 2017; that is,...
asked 50 minutes ago