

Homework Answers

For (10), similarly as before join the t = 6s to t = 10s by the line AB, then,
Average velocity = Slope of line AB = BC/CA
= 3.5/4 = 0.8 m/s
Option (b).
Add Answer to:
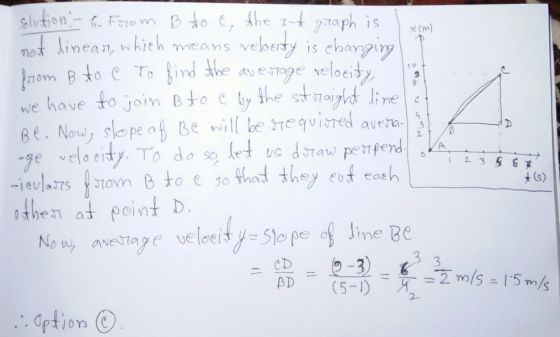
6. An object moves along the x-axis. The graph shows its position x as a function...
x (m) 10- 4- B → t(s) 0 1 23 45 6 (1 point) 1.8 m/s...
 x (m) 10- 4- B → t(s) 0 1 23 45 6 (1 point) 1.8 m/s 1.0 m/s 1.5 m/s 0.67 m/s 8. What is the instantaneous velocity at1 h? x(km) 수 50 40B 30 20 10- t (h) 0 2 4 68 10 O 3 km/h 0.2 km/h 15 km/h O 30 km/h 10. A person is walking briskly in a straight line. The figure shows a graph of the person's position (1 point) as a function of time...
An object moves along the x-axis with its position x, in meters, given as a function...
 An object moves along the x-axis with its position x, in meters, given as a function of time t, in seconds, by x(-1.417-9.491+ 4.68 r(t)-1.41 t2-9.4% + 4.68 What is the object's velocity at time t 1.01 s? Number m/ s
Suppose that an object moves along the x axis. its x-position as a function of time...
Suppose that an object moves along the x axis. its x-position as a function of time is x(t) = A sin (theta t). what are the x, y, and z components of it's velocity as a function of time?
Suppose that an object moves along the x axis. Its x-position as a function of time...
Suppose that an object moves along the x axis. Its x-position as a function of time is x(t)=Asinwt, where A and w are constants. What are the x, y, and z components of its velocity as a function of time?
Problem 2 The graph below shows the position (x) as a function of time (t) for...
 Problem 2 The graph below shows the position (x) as a function of time (t) for a particle moving in one dimension x (m) 6 5 4. 3 2 t(s) 3 4 5 6 7 8 9 10 11 12 (a) During which interval(s) of time is the particle at rest? (b) During which interval(s) of time is the particle's velocity (Vx) negative? (e) During which interval(s) of time is the particle decelerating? (d) Find the particle's velocity at t...
A position-time graph for a particle moving along the x axis is shown in the figure...
 A position-time graph for a particle moving along the x axis is shown in the figure below x (m) 12 10 8 6 t (s) 02 3 4 5 6 (a) Find the average velocity in the time intervalt2.00s tot-4.00s. (Indicate the direction with the sign of your answer) m/s (b) Determine the instantaneous velocity at t = 2.00 s by measuring the slope of the tangent line shown in the graph. (Note that t Indicate the direction with the...
An object is at x at t and moves along the x axis according to the...
 An object is at x at t and moves along the x axis according to the velocity-time graph shown below v (m/s) 20 10 -10 (a) What is the object's acceleration between 0 and 4.0 s? m/s2 (b) What is the object's acceleration between 4.0 s and 9.0 s? m/s2 (C) What is the object's acceleration between 13.0 s and 18.0 s? m/s2 (d) At what time(s) is the object moving with the lowest speed? (If there is more than...
The plot below shows the velocity vs. time for an object moving along the x axis....
 The plot below shows the velocity vs. time for an object moving
along the x axis. The object is initially at position x = 0 at time
t = 0. Assume two significant figures for your graph
values.
a. Find an equation for the velocity v(t)
2. The plot below shows the velocity vs. time for an object moving along the x axis. The object is initially at position x = 0 at time t = 0, Assume two significant...
The plot below shows the velocity vs. time for an object moving
along the x axis. The object is initially at position x = 0 at time
t = 0. Assume two significant figures for your graph
values.
a. Find an equation for the velocity v(t)
2. The plot below shows the velocity vs. time for an object moving along the x axis. The object is initially at position x = 0 at time t = 0, Assume two significant...
The graph shows the force acting on an object as a function of the position of...
 The graph shows the force acting on an object as a function of the position of the object. For each numbered interval given, find the work W, done on the object. 1)from x = 0 m to x = 2.10m 0 x(m) 8 9 10 -2 2) from x 3.00 m to x 5.50 m -6 W2 = 3) from x = 7.00 m to x = 8.70 m
An object is moving along a straight line in the positive x direction. The graph shows...
 An object is moving along a straight line in the positive x direction. The graph shows its position from the starting point as a function of time. Various segments of the graph are identified by the letters A, B, C, and D. a. Describe what the object is doing during each segment of the trip. Calculate all constant variables. b. What is the average velocity for the trip.
 x (m) 10- 4- B → t(s) 0 1 23 45 6 (1 point) 1.8 m/s 1.0 m/s 1.5 m/s 0.67 m/s 8. What is the instantaneous velocity at1 h? x(km) 수 50 40B 30 20 10- t (h) 0 2 4 68 10 O 3 km/h 0.2 km/h 15 km/h O 30 km/h 10. A person is walking briskly in a straight line. The figure shows a graph of the person's position (1 point) as a function of time...
 An object moves along the x-axis with its position x, in meters, given as a function of time t, in seconds, by x(-1.417-9.491+ 4.68 r(t)-1.41 t2-9.4% + 4.68 What is the object's velocity at time t 1.01 s? Number m/ s
 Problem 2 The graph below shows the position (x) as a function of time (t) for a particle moving in one dimension x (m) 6 5 4. 3 2 t(s) 3 4 5 6 7 8 9 10 11 12 (a) During which interval(s) of time is the particle at rest? (b) During which interval(s) of time is the particle's velocity (Vx) negative? (e) During which interval(s) of time is the particle decelerating? (d) Find the particle's velocity at t...
 A position-time graph for a particle moving along the x axis is shown in the figure below x (m) 12 10 8 6 t (s) 02 3 4 5 6 (a) Find the average velocity in the time intervalt2.00s tot-4.00s. (Indicate the direction with the sign of your answer) m/s (b) Determine the instantaneous velocity at t = 2.00 s by measuring the slope of the tangent line shown in the graph. (Note that t Indicate the direction with the...
 An object is at x at t and moves along the x axis according to the velocity-time graph shown below v (m/s) 20 10 -10 (a) What is the object's acceleration between 0 and 4.0 s? m/s2 (b) What is the object's acceleration between 4.0 s and 9.0 s? m/s2 (C) What is the object's acceleration between 13.0 s and 18.0 s? m/s2 (d) At what time(s) is the object moving with the lowest speed? (If there is more than...
 The plot below shows the velocity vs. time for an object moving
along the x axis. The object is initially at position x = 0 at time
t = 0. Assume two significant figures for your graph
values.
a. Find an equation for the velocity v(t)
2. The plot below shows the velocity vs. time for an object moving along the x axis. The object is initially at position x = 0 at time t = 0, Assume two significant...
The plot below shows the velocity vs. time for an object moving
along the x axis. The object is initially at position x = 0 at time
t = 0. Assume two significant figures for your graph
values.
a. Find an equation for the velocity v(t)
2. The plot below shows the velocity vs. time for an object moving along the x axis. The object is initially at position x = 0 at time t = 0, Assume two significant...
 The graph shows the force acting on an object as a function of the position of the object. For each numbered interval given, find the work W, done on the object. 1)from x = 0 m to x = 2.10m 0 x(m) 8 9 10 -2 2) from x 3.00 m to x 5.50 m -6 W2 = 3) from x = 7.00 m to x = 8.70 m
 An object is moving along a straight line in the positive x direction. The graph shows its position from the starting point as a function of time. Various segments of the graph are identified by the letters A, B, C, and D. a. Describe what the object is doing during each segment of the trip. Calculate all constant variables. b. What is the average velocity for the trip.
Most questions answered within 3 hours.
-
A new battery's voltage may be acceptable (A) or unacceptable
(U). A certain flashlight requires two...
asked 1 minute ago -
Water has significant IMF, which result in many of its unique
properties—high boiling point relative to...
asked 21 minutes ago -
I need help with an executive summary for Adidas Items to be
included are a discription...
asked 14 minutes ago -
19. Most progressive reform activists were white
and a. upper class. b. lower class. c. wokring...
asked 16 minutes ago -
If X is a binomial random variable with n = 8
and p = 0.2, the...
asked 26 minutes ago -
Seasonal or cyclical variation in a time-series model…
---exhibits irregular
variation that can be accounted for...
asked 27 minutes ago -
Please use Barney's VRIO framework of analysis to evaluate a
firm's competencies. Please choose a specific...
asked 40 minutes ago -
Where would you expect to have diabetes contributing to the most
DALYs in 2035, according to...
asked 41 minutes ago -
1.) Major league baseball salaries averaged $1.5 million with a
standard deviation of $1 million in...
asked 50 minutes ago -
A hedge fund is holding a three-year,
$10 million face value 6 percent annual coupon bond...
asked 1 hour ago -
The focal length of a makeup (concave) mirror is 0.48 m. What
magnification does this mirror...
asked 1 hour ago -
TRUE/FALSE
Long-lived assets that are tangible in nature, used in the
operations of the business, and...
asked 1 hour ago