Assume the price of steel per ton is 100$/ton for a steel factory when the factory...
Assume the price of steel per ton is 100$/ton for a steel
factory when the factory sells 100 tons perd ay. Also, assume for
each additional 100 tons the price falls 7.5$. Assume in order to
produce per 100 ton the factory employs 10 workers. Assume daily
wage is 100$ per day. Take 100 tons as 1 unit. Also, assume the
number of workers company hires and fires is a factor of 10. So
calculate whenever you calculate marginal calculate, marginal labor
cost per worker for the last 10 workers. Also, assume all other
costs except the labor costs are negligible.
a) Construct a table that shows marginal revenue, total revenue and
average revenue for every 100 ton, between the production levels
100 ton and 1000 ton of steel.
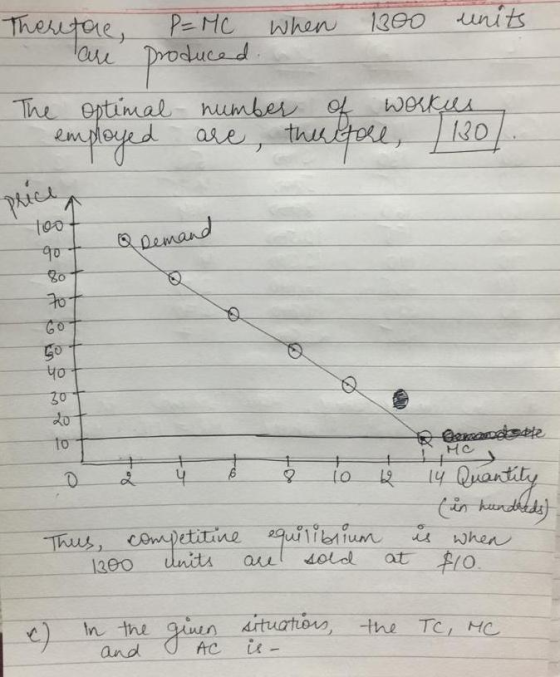
b) What will be the optimum number of workers employed in that
case? Draw the graph for the perfectly competitive case. Show the
competitive market equilibrium
c) Assume the factory relocated itself near a small town with a
very little labor supply. Now assume labor market is competitive
and wage rate is 100$ per day when the factory employs 10 workers,
however it rises by 15$ per additional 10 workers factory employs.
Assume the revenue structure of the factory has remained the same.
(Price level per ton of steel sold is the same.) Construct a table
showing marginal cost, total cost and the average cost for every
100 ton of steel between production
levels 100 ton and 1000 tons of steel.
d) Draw the graph of a monopsony case. How much is the exploitation
in this case? Show the competitive market equilibrium and the
optimum point for the monopsony on your graph
Homework Answers


Add Answer to:
Assume the price of steel per ton is 100$/ton for a steel
factory when the factory...
Suppose Kingston Steel Inc. hires its workers in a competitive labour market. Currently, the firm employs...
Suppose Kingston Steel Inc. hires its workers in a competitive labour market. Currently, the firm employs 1,000 workers at the wage of $40,000 per year and produces 50,000 tons of steel per year. The steel market is perf ctly competitive and the price of steel is $2,000 per ton. If they hired one more worker, their total revenue would A.not change. B.increase approximately by $50,000 per year. C.increase approximately by $2,000 per year. D.increase approximately by $100,000 per year. E。increase...
PRICE (Dollars per ton of paper) Consider the market for paper. Suppose that a paper factory...
 PRICE (Dollars per ton of paper) Consider the market for paper. Suppose that a paper factory dumps toxic waste into a nearby river, creating a negative externality for those living downstream from the factory. Producing an additional ton of paper imposes a constant external cost of $450 per ton. The following graph shows the demand (private value) curve and the supply (private cost) curve for paper. Use the purple points (diamond symbol) to plot the social cost curve when the...
CİSES 1. Consider the following supply and demand schedule for steel: 20 40 60 80 100...
 CİSES 1. Consider the following supply and demand schedule for steel: 20 40 60 80 100 120 140 160 180 Qp (million tons) 200 180 160 140 120 100 80 60 40 20 60 100 140 180 220 260 300 340 Price per ton (S) Qs (million tons) Pollution from steel production is estimated to create an external cost of S60 per ton. Show the external cost, market equilibrium, and social optimum in a graph. What kinds of policies might...
The graph illustrates the unregulated market for pesticide. Price (dollars per ton) 720- When the factories produce pes...
 The graph illustrates the unregulated market for pesticide. Price (dollars per ton) 720- When the factories produce pesticide, they also create waste, which they dump into a lake on the outskirts of a small town. 640- 560- The marginal external cost of the dumped waste is equal to twice the marginal private cost. So the marginal social cost of producing pesticide is three times the marginal private cost. 480 400- If the residents of the town own the lake, how...
5. Short-run supply and long-run equilibrium Consider the perfectly competitive market for steel. Assume that, regardless...
 5. Short-run supply and long-run equilibrium Consider the perfectly competitive market for steel. Assume that, regardless of how many firms are in the industry, every firm in the industry is identical and faces the marginal cost (MC), average total cost (ATC), and average variable cost (AVC) curves shown on the following graph. COSTS (Dollars per ton) + MC D AVC 0 10 90 100 20 30 40 50 60 70 80 QUANTITY (Thousands of tons) The following diagram shows the...
3. Vanguard sells specialized steel at a price of $450 per ton. Plant capacity is 10,000...
 3. Vanguard sells specialized steel at a price of $450 per ton. Plant capacity is 10,000 tons year and fixed costs are $1.500,000 per year. Average variable costs per ton (assumed to be constant) are as follows Direct labor Direct materials Variable manufacturing overhead Variable selling expense $100 90 40 20 How many tons of steel would it need to sell in order to make a profit of $400,000 per year? (12)
Consider the Australian steel market. Australia is a small country and cannot influence the world price...
Consider the Australian steel market. Australia is a small country and cannot influence the world price of steel which is $30 per ton. At this price, Australian demand for steel would be 120 tons. Nevertheless, Australia currently imposes a tariff of $10 per ton on steel imports. Demand for steel under this tariff is 100 tons. Suppose now that Australia is considering entering a trade agreement with Korea that would reduce the tariff on Korean steel to zero while maintaining...
Deciding how many workers to hire: Assume that the initial price of shoes in this example is $30 per pair
1. Deciding how many workers to hire: Assume that the initial price of shoes in this example is $30 per pair. What is the marginal revenue product for each worker? Fill in the following chart and graph each function.Number of workers01234567Total Output Of shoes08152126293130Marginal Output of shoesMarginal Revenue Product (a.k.a. value of the marginal product of labor)a. If it costs the firm $90 per worker per day, how many workers would be hired? Why? b. If the price of shoes was...
The graph illustrates the unregulated market for pulp and paper Price (dollars per ton into a...
 The graph illustrates the unregulated market for pulp and paper Price (dollars per ton into a river that runs through a small town. The marginal external cost of the dumped waste is equal to twice the marginal private cost. So the marginal social cost of producing pulp and paper is three times the marginal private cost. What is the quantity of pulp and paper produced if no one owns the river? What is the deadweight loss from pulp and paper...
7. Short-run supply and long-run equillbrium Consider the competitive market for steel. Assume that, regardless of...
 7. Short-run supply and long-run equillbrium Consider the competitive market for steel. Assume that, regardless of how many firms are in the industry, every firm in the industry is identical and faces the marginal cost (MC), average total cost (ATC), and average variable cost (AVC) curves shown on the following graph 100 90 27.5, 70 80 70 30 20 AVC 10 0s10 1520 25 30 35 40 45 QUANTITY (Thousands of tons) The following diagram shows the market demand for...
 PRICE (Dollars per ton of paper) Consider the market for paper. Suppose that a paper factory dumps toxic waste into a nearby river, creating a negative externality for those living downstream from the factory. Producing an additional ton of paper imposes a constant external cost of $450 per ton. The following graph shows the demand (private value) curve and the supply (private cost) curve for paper. Use the purple points (diamond symbol) to plot the social cost curve when the...
 CİSES 1. Consider the following supply and demand schedule for steel: 20 40 60 80 100 120 140 160 180 Qp (million tons) 200 180 160 140 120 100 80 60 40 20 60 100 140 180 220 260 300 340 Price per ton (S) Qs (million tons) Pollution from steel production is estimated to create an external cost of S60 per ton. Show the external cost, market equilibrium, and social optimum in a graph. What kinds of policies might...
 The graph illustrates the unregulated market for pesticide. Price (dollars per ton) 720- When the factories produce pesticide, they also create waste, which they dump into a lake on the outskirts of a small town. 640- 560- The marginal external cost of the dumped waste is equal to twice the marginal private cost. So the marginal social cost of producing pesticide is three times the marginal private cost. 480 400- If the residents of the town own the lake, how...
 5. Short-run supply and long-run equilibrium Consider the perfectly competitive market for steel. Assume that, regardless of how many firms are in the industry, every firm in the industry is identical and faces the marginal cost (MC), average total cost (ATC), and average variable cost (AVC) curves shown on the following graph. COSTS (Dollars per ton) + MC D AVC 0 10 90 100 20 30 40 50 60 70 80 QUANTITY (Thousands of tons) The following diagram shows the...
 3. Vanguard sells specialized steel at a price of $450 per ton. Plant capacity is 10,000 tons year and fixed costs are $1.500,000 per year. Average variable costs per ton (assumed to be constant) are as follows Direct labor Direct materials Variable manufacturing overhead Variable selling expense $100 90 40 20 How many tons of steel would it need to sell in order to make a profit of $400,000 per year? (12)
 The graph illustrates the unregulated market for pulp and paper Price (dollars per ton into a river that runs through a small town. The marginal external cost of the dumped waste is equal to twice the marginal private cost. So the marginal social cost of producing pulp and paper is three times the marginal private cost. What is the quantity of pulp and paper produced if no one owns the river? What is the deadweight loss from pulp and paper...
 7. Short-run supply and long-run equillbrium Consider the competitive market for steel. Assume that, regardless of how many firms are in the industry, every firm in the industry is identical and faces the marginal cost (MC), average total cost (ATC), and average variable cost (AVC) curves shown on the following graph 100 90 27.5, 70 80 70 30 20 AVC 10 0s10 1520 25 30 35 40 45 QUANTITY (Thousands of tons) The following diagram shows the market demand for...
Most questions answered within 3 hours.
-
In winter a lake has a 0.35 m thick ice layer over 1.10 m of
water....
asked 4 minutes ago -
Assuming the following has been encrypted with a Vigenere cipher
below, use the method(s) and assumptions...
asked 29 minutes ago -
How would I use switch statements to write a program that will
take an input of...
asked 20 minutes ago -
Imagine a reaction in which methane gas combusts at a constant
pressure of 1 atm and...
asked 31 minutes ago -
Two parallel wires (each 12 m in length) are separated by a
distance of 0.065 m...
asked 28 minutes ago -
Suppose there were three masses at the corner of uniform
equilateral triangle. The masses are m1...
asked 30 minutes ago -
Situation: A building that is 618 m above the ground floor. How
many times would a...
asked 34 minutes ago -
help me and discuss one successful and one
unsuccessful international company/busines in Indonesia.whyit
succeed and why...
asked 42 minutes ago -
I- Choose the best answer
Which of the following statements about the structure and
packaging of...
asked 42 minutes ago -
1. A sample of 144 incoming freshman found that 45 of them
scored more than 550...
asked 49 minutes ago -
Kc is 2.35 × 10¹⁸ at 25 °C for the formation of iron(III)
oxalate complex ion....
asked 50 minutes ago -
Team Values – Discuss as a team what values are important.
Develop a statement or itemised...
asked 1 hour ago