


Homework Answers
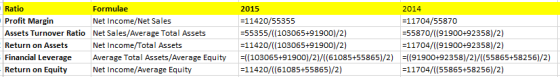
The ratios can be calculated in the following manner:
| Ratio | Formulae | 2015 | 2014 |
| Profit Margin | Net Income/Net Sales | 20.63% | 20.95% |
| Assets Turnover Ratio | Net Sales/Average Total Assets | 56.78% | 60.64% |
| Return on Assets | Net Income/Total Assets | 11.71% | 12.70% |
| Financial Leverage | Average Total Assets/Average Equity | 1.67 | 1.61 |
| Return on Equity | Net Income/Average Equity | 19.53% | 20.51% |
Explanation
There are different ways and formulae how these ratios can be calculated. The above method is just 1 way of solving these. In case of any issues, please drop a comment
Please hit LIKE button if this helped. For any further explanation, please put your query in comment, will get back to you.
Add Answer to:
i need help on finding
need help on finding the rations 1-5.
Compute the financial ratios...
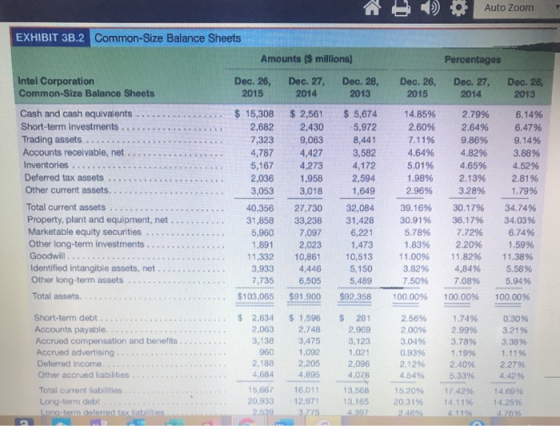
What formula do you use in excel to convert a consolidated balance sheet into a common...
 What formula do you use in excel to convert a
consolidated balance sheet into a common size balance sheet.
Formatting . Table Styles . Styles Filter Select Clipboard Font Alignment Cells Editing B38 Consolidated Balance Sheet (In Millions, Except Par Value) 2012 Common Size Balance Sheet 1 December 28, 2013; December 29, 2012; and December 31, 2011 2-1 (in Millions, Except Par Value) 3 Assets 4 Current assets: 5 Cash and cash equivalents 6 Short-term investments 7 Trading assets 8Accounts...
What formula do you use in excel to convert a
consolidated balance sheet into a common size balance sheet.
Formatting . Table Styles . Styles Filter Select Clipboard Font Alignment Cells Editing B38 Consolidated Balance Sheet (In Millions, Except Par Value) 2012 Common Size Balance Sheet 1 December 28, 2013; December 29, 2012; and December 31, 2011 2-1 (in Millions, Except Par Value) 3 Assets 4 Current assets: 5 Cash and cash equivalents 6 Short-term investments 7 Trading assets 8Accounts...
I need help finding different risk ratios. Can someone please show me how to get the...
 I need help finding different risk ratios. Can someone please
show me how to get the following in detail?
What is Exxon's...
1. receivables turnover ratio?
2. average collection period?
3. inventory turnover ratio?
4. average days in inventory?
5. current ratio?
6. acid-test ratio?
7. debt to equity ratio?
8. times interest earned ratio?
Thank you!
CONSOLIDATED BALANCE SHEET Note Reference Number Dec. 31 Dec. 31 2018 (millions of dollars) 2017 3,042 24,701 3,177 25,597 Assets Current assets Cash...
I need help finding different risk ratios. Can someone please
show me how to get the following in detail?
What is Exxon's...
1. receivables turnover ratio?
2. average collection period?
3. inventory turnover ratio?
4. average days in inventory?
5. current ratio?
6. acid-test ratio?
7. debt to equity ratio?
8. times interest earned ratio?
Thank you!
CONSOLIDATED BALANCE SHEET Note Reference Number Dec. 31 Dec. 31 2018 (millions of dollars) 2017 3,042 24,701 3,177 25,597 Assets Current assets Cash...
Forecasting and Estimating Share Value Using the DCF Model Following are the income statement and...
Forecasting and Estimating Share Value Using the DCF Model Following are the income statement and balance sheet for Intel Corporation. INTEL CORPORATION Consolidated Statements of Income Year Ended (In millions) Dec. 25, 2010 Dec. 26, 2009 Dec. 27, 2008 Net revenue $ 44,123 $ 35,127 $ 37,586 Cost of sales 15,132 15,566 16,742 Gross margin 28,991 19,561 20,844 Research and development 6,576 5,653 5,722 Marketing, general and administrative 6,309 7,931 5,452 Restructuring and asset impairment charges -- 231 710 Amortization...
Forecasting and Estimating Share Value Using the DCF Model Following are the income statement and balance...
Forecasting and Estimating Share Value Using the DCF Model Following are the income statement and balance sheet for Intel Corporation. INTEL CORPORATION Consolidated Statements of Income Year Ended (In millions) Dec. 25, 2010 Dec. 26, 2009 Dec. 27, 2008 Net revenue $ 44,423 $ 35,127 $ 37,586 Cost of sales 15,132 15,566 16,742 Gross margin 29,291 19,561 20,844 Research and development 6,576 5,653 5,722 Marketing, general and administrative 6,309 7,931 5,452 Restructuring and asset impairment charges -- 231 710 Amortization...
I need help finding the Debt to Equity Ratio. Here are the two balance sheets that...
 I need help finding the Debt to Equity Ratio. Here are the two
balance sheets that were provided. I know that all of my other
calculations are correct.
answers should look like -0.05 or 1.33 2016 2015 2014 1.92 % 6.34 % 1.51 % Operating Income to Revenue 0.54 % 0.79% 1.04 % Current Ratio 0.20 Cash Ratio 0.35 0.27 Debt to Equity JAMBA, INC. CONSOLIDATED BALANCE SHEETS December 29, December 29, December 30, 2011 (Dollars in thousands, except share...
I need help finding the Debt to Equity Ratio. Here are the two
balance sheets that were provided. I know that all of my other
calculations are correct.
answers should look like -0.05 or 1.33 2016 2015 2014 1.92 % 6.34 % 1.51 % Operating Income to Revenue 0.54 % 0.79% 1.04 % Current Ratio 0.20 Cash Ratio 0.35 0.27 Debt to Equity JAMBA, INC. CONSOLIDATED BALANCE SHEETS December 29, December 29, December 30, 2011 (Dollars in thousands, except share...
BALANCE SHEET INCOME STATEMENT ** HW DUE *** Need to find these ratios below. Need one for nike and for adidas for 201...
 BALANCE SHEET
INCOME STATEMENT
** HW DUE *** Need to find these ratios below. Need one for nike
and for adidas for 2018 then one for 2019. EVEN if your only able
to do a couple it will be greatly appreciated!
ADIDAS NIKE Breakdown 5/31/2019 5/31/2018 Breakdown 12/31/2018 12/31/2017 v Assets v Assets Current Assets Current Assets Cash vCash Cash And Cash Equivalents 4,466,000 4249,000 Cash And Cash Equivalents 2.629,000 1,598,000 Short Term Investments 197,000 996,000 Short Term Investments 274,000...
BALANCE SHEET
INCOME STATEMENT
** HW DUE *** Need to find these ratios below. Need one for nike
and for adidas for 2018 then one for 2019. EVEN if your only able
to do a couple it will be greatly appreciated!
ADIDAS NIKE Breakdown 5/31/2019 5/31/2018 Breakdown 12/31/2018 12/31/2017 v Assets v Assets Current Assets Current Assets Cash vCash Cash And Cash Equivalents 4,466,000 4249,000 Cash And Cash Equivalents 2.629,000 1,598,000 Short Term Investments 197,000 996,000 Short Term Investments 274,000...
P4-42. Compute the DuPont Disaggregation of ROE Refer to the balance sheets and income statement below...
 P4-42. Compute the DuPont Disaggregation of ROE Refer to the balance sheets and income statement below for Under Armour Inc. UNDER ARMOUR INC. Consolidated Statements of Income For 12 Months Ended ($ in 000s) Dec. 31, 2015 M Net revenues ................................ Cost of goods sold ......... Gross profit.. Selling, general and administrative expenses ....... Income from operations ........ Interest expense, net ....... Other expense, net..................................................... Income before income taxes........... Provision for income taxes............... Net income.... o n o polduOHS. ...............
U2 - Financial Statement Analysis (50 min) Calculate at least 4 ratios for EACH of the...
 U2 - Financial Statement Analysis (50 min) Calculate at least 4 ratios for EACH of the following ratio categories (profitability, liquidity, solvency, efficiency) Intepret the results. Best Buy Ltd. Statement of Earnings (Income Statement) For the Year Ended Dec 31, 2017 In millions of dollars 2013 2014 2015 2016 2017 Revenue Computers Phones Software & Gaming Total Revenue $150.00 $75.00 $50.00 $172.50 $150.00 $62.50 $385.00 $198.38 $210.00 $78.13 $486.50 $62.50 $228.13 $294.00 $97.66 $619.79 $262.35 $411.60 $122.07 $796.02 $275.00 $96.25...
Problem 13-2A Ratios, common-size statements, and trend percents LO P1, P2, P3 [The following information applies...
 Problem 13-2A Ratios, common-size statements, and trend percents LO P1, P2, P3 [The following information applies to the questions displayed below.] Selected comparative financial statements of Korbin Company follow KORBIN COMPANY Comparative Income Statements For Years Ended December 31, 2015, 2014, and 2013 2015 2014 Sales $ 554,143 $ 424,519 Cost of goods sold 333,594 266,173 2013 $ 294,600 188,544 Gross profit Selling expenses Administrative expenses 220,549 78,688 49,873 158,346 58,584 37,358 106,056 38,887 24,452 Total expenses 128,561 95,942 63,339...
The Hershey Company Analysis Using the financial statements of the Hershey Company compute the following ratios...
 The Hershey Company Analysis Using the financial statements of the Hershey Company compute the following ratios (hint: when computing the return on equity use the amount for Total Stockholders' Equity when computing the average) for 2019: 5. Asset turnover ratio 6. Profit margin on sales 7. Return on assets 8. Return on equity 2019 2018 THE HERSHEY COMPANY CONSOLIDATED BALANCE SHEETS (in thousands, except share data) December 31. ASSETS Current assets: Cash and cash equivalents Accounts receivable trade, net Inventories...
 What formula do you use in excel to convert a
consolidated balance sheet into a common size balance sheet.
Formatting . Table Styles . Styles Filter Select Clipboard Font Alignment Cells Editing B38 Consolidated Balance Sheet (In Millions, Except Par Value) 2012 Common Size Balance Sheet 1 December 28, 2013; December 29, 2012; and December 31, 2011 2-1 (in Millions, Except Par Value) 3 Assets 4 Current assets: 5 Cash and cash equivalents 6 Short-term investments 7 Trading assets 8Accounts...
What formula do you use in excel to convert a
consolidated balance sheet into a common size balance sheet.
Formatting . Table Styles . Styles Filter Select Clipboard Font Alignment Cells Editing B38 Consolidated Balance Sheet (In Millions, Except Par Value) 2012 Common Size Balance Sheet 1 December 28, 2013; December 29, 2012; and December 31, 2011 2-1 (in Millions, Except Par Value) 3 Assets 4 Current assets: 5 Cash and cash equivalents 6 Short-term investments 7 Trading assets 8Accounts...
 I need help finding different risk ratios. Can someone please
show me how to get the following in detail?
What is Exxon's...
1. receivables turnover ratio?
2. average collection period?
3. inventory turnover ratio?
4. average days in inventory?
5. current ratio?
6. acid-test ratio?
7. debt to equity ratio?
8. times interest earned ratio?
Thank you!
CONSOLIDATED BALANCE SHEET Note Reference Number Dec. 31 Dec. 31 2018 (millions of dollars) 2017 3,042 24,701 3,177 25,597 Assets Current assets Cash...
I need help finding different risk ratios. Can someone please
show me how to get the following in detail?
What is Exxon's...
1. receivables turnover ratio?
2. average collection period?
3. inventory turnover ratio?
4. average days in inventory?
5. current ratio?
6. acid-test ratio?
7. debt to equity ratio?
8. times interest earned ratio?
Thank you!
CONSOLIDATED BALANCE SHEET Note Reference Number Dec. 31 Dec. 31 2018 (millions of dollars) 2017 3,042 24,701 3,177 25,597 Assets Current assets Cash...
 I need help finding the Debt to Equity Ratio. Here are the two
balance sheets that were provided. I know that all of my other
calculations are correct.
answers should look like -0.05 or 1.33 2016 2015 2014 1.92 % 6.34 % 1.51 % Operating Income to Revenue 0.54 % 0.79% 1.04 % Current Ratio 0.20 Cash Ratio 0.35 0.27 Debt to Equity JAMBA, INC. CONSOLIDATED BALANCE SHEETS December 29, December 29, December 30, 2011 (Dollars in thousands, except share...
I need help finding the Debt to Equity Ratio. Here are the two
balance sheets that were provided. I know that all of my other
calculations are correct.
answers should look like -0.05 or 1.33 2016 2015 2014 1.92 % 6.34 % 1.51 % Operating Income to Revenue 0.54 % 0.79% 1.04 % Current Ratio 0.20 Cash Ratio 0.35 0.27 Debt to Equity JAMBA, INC. CONSOLIDATED BALANCE SHEETS December 29, December 29, December 30, 2011 (Dollars in thousands, except share...
 BALANCE SHEET
INCOME STATEMENT
** HW DUE *** Need to find these ratios below. Need one for nike
and for adidas for 2018 then one for 2019. EVEN if your only able
to do a couple it will be greatly appreciated!
ADIDAS NIKE Breakdown 5/31/2019 5/31/2018 Breakdown 12/31/2018 12/31/2017 v Assets v Assets Current Assets Current Assets Cash vCash Cash And Cash Equivalents 4,466,000 4249,000 Cash And Cash Equivalents 2.629,000 1,598,000 Short Term Investments 197,000 996,000 Short Term Investments 274,000...
BALANCE SHEET
INCOME STATEMENT
** HW DUE *** Need to find these ratios below. Need one for nike
and for adidas for 2018 then one for 2019. EVEN if your only able
to do a couple it will be greatly appreciated!
ADIDAS NIKE Breakdown 5/31/2019 5/31/2018 Breakdown 12/31/2018 12/31/2017 v Assets v Assets Current Assets Current Assets Cash vCash Cash And Cash Equivalents 4,466,000 4249,000 Cash And Cash Equivalents 2.629,000 1,598,000 Short Term Investments 197,000 996,000 Short Term Investments 274,000...
 P4-42. Compute the DuPont Disaggregation of ROE Refer to the balance sheets and income statement below for Under Armour Inc. UNDER ARMOUR INC. Consolidated Statements of Income For 12 Months Ended ($ in 000s) Dec. 31, 2015 M Net revenues ................................ Cost of goods sold ......... Gross profit.. Selling, general and administrative expenses ....... Income from operations ........ Interest expense, net ....... Other expense, net..................................................... Income before income taxes........... Provision for income taxes............... Net income.... o n o polduOHS. ...............
 U2 - Financial Statement Analysis (50 min) Calculate at least 4 ratios for EACH of the following ratio categories (profitability, liquidity, solvency, efficiency) Intepret the results. Best Buy Ltd. Statement of Earnings (Income Statement) For the Year Ended Dec 31, 2017 In millions of dollars 2013 2014 2015 2016 2017 Revenue Computers Phones Software & Gaming Total Revenue $150.00 $75.00 $50.00 $172.50 $150.00 $62.50 $385.00 $198.38 $210.00 $78.13 $486.50 $62.50 $228.13 $294.00 $97.66 $619.79 $262.35 $411.60 $122.07 $796.02 $275.00 $96.25...
 Problem 13-2A Ratios, common-size statements, and trend percents LO P1, P2, P3 [The following information applies to the questions displayed below.] Selected comparative financial statements of Korbin Company follow KORBIN COMPANY Comparative Income Statements For Years Ended December 31, 2015, 2014, and 2013 2015 2014 Sales $ 554,143 $ 424,519 Cost of goods sold 333,594 266,173 2013 $ 294,600 188,544 Gross profit Selling expenses Administrative expenses 220,549 78,688 49,873 158,346 58,584 37,358 106,056 38,887 24,452 Total expenses 128,561 95,942 63,339...
 The Hershey Company Analysis Using the financial statements of the Hershey Company compute the following ratios (hint: when computing the return on equity use the amount for Total Stockholders' Equity when computing the average) for 2019: 5. Asset turnover ratio 6. Profit margin on sales 7. Return on assets 8. Return on equity 2019 2018 THE HERSHEY COMPANY CONSOLIDATED BALANCE SHEETS (in thousands, except share data) December 31. ASSETS Current assets: Cash and cash equivalents Accounts receivable trade, net Inventories...
Most questions answered within 3 hours.
-
An entomologist discovers a dung beetle rolling a ball of dung
along the ground, and decides...
asked 1 hour ago -
Humans have used horses for transportation for millions of
years. Therefore, they will use horses for...
asked 2 hours ago -
The following are the Jensen Corporation's unit costs of making
and selling an item at a...
asked 3 hours ago -
Does direct Medicare reimbursement of Advanced practice nurses
increase access to their services?
asked 4 hours ago -
List and explain why a company would choose to use a
published
compensation survey vs. creating...
asked 4 hours ago -
A discrete random variable X can take values from 1 to 10. Find
the variance of...
asked 4 hours ago -
The primary financial goal of a corporation is to maximize:
shareholders wealth.
earnings per share.
stock...
asked 4 hours ago -
determine whether the vectors u=(1,2,3,), v=(-2,1,0) and
w=(1,0,1) are linearly dependent or independent.
asked 4 hours ago -
python
Define a function called print_values which takes a dictionary
object as a parameter. The function...
asked 5 hours ago -
In Chapter 1 you created a program named Triangle in
which you displayed a seven-line triangle...
asked 5 hours ago -
Research question: What are the differences between separately
stated and non separately stated transactions in an...
asked 6 hours ago -
By using Arduino write a code that connects two LEDs to two
push-buttons. Each button controls...
asked 7 hours ago