
Homework Answers
the frequency distribution represent the frequencies of observation when we arrange observations in ascending order and relative frequency represent the ratio of certain observation with total number of observation and CRF is the sum of the all relative frequencies up to that observation included relative frequency of such observation.
hope you understand well. please give your good rating to answer.
Add Answer to:
Consider the discrete data in the table below a) Construct a frequern Data ValueF a) Construct...
Consider the discrete data in the table below. a) Construct a frequency distribution. b) Construct a...
Consider the discrete data in the table below. a) Construct a frequency distribution. b) Construct a relative frequency distribution. c) Construct a cumulative relative frequency distribution. 11 44 44 11 44 11 33 22 55 11 22 22 44 22 55 22 11 22 33 44 11 33 22 44 a) Construct a frequency distribution. Data Value Frequency 1 nothing 2 nothing 3 nothing 4 nothing 5 nothing
Consider the following data set 14.8 7.2 8.7 9.6 13.1 13.8 7.5 10.1 9.9 9.9 11.9...
 Consider the following data set 14.8 7.2 8.7 9.6 13.1 13.8 7.5 10.1 9.9 9.9 11.9 4.7 14.8 8.1 10.6 3.8 4.6 12.5 7.9 6.6 10.3 13.3 7.26.8 7.3 7.2 8.7 5.2 5.2 13.1 Click here for the Excel Data File a. Construct the frequency distribution using classes of 3 up to 5, 5 up to 7, etc. Class Frequency 3 up to 5 5 up to 7 7 up to 9 9 up to 11 11 up to 13...
Construct a frequency distribution for the given data set using 6 classes. In the table, include...
 Construct a frequency distribution for the given data set using 6 classes. In the table, include the midpoints, relative frequencies, and cumulative frequencies. Which class has the greatest frequency and which has the least frequency? Amount (in dollars) spent on books for a semester 118 228 309 289 413 518 331 46 389 72 89 133 357 415 3850 42 476 170 40 103 121 75 315 334 402 138 324 289 331 Complete the table, starting with the lowest...
Construct a frequency distribution for the given data set using 6 classes. In the table, include...
Construct a frequency distribution for the given data set using 6 classes. In the table, include the midpoints, relative frequencies, and cumulative frequencies. Which class has the greatest frequency and which has the least frequency? Amount (in dollars) spent on books for a semester 197 472 330 223 184 522 481 306 442 287 470 353 345 165 81 141 65 95 40 520 341 59 183 305 132 393 488 297 447 Complete the table, starting with the lowest...
Construct a frequency distribution for the given data set using 6 classes. In the table, include...
 Construct a frequency distribution for the given data set using 6 classes. In the table, include the midpoints, relative frequencies, and cumulative frequencies. Which class has the greatest frequency and which has the least frequency? Amount (in dolars) spent on books for a semester 289 327 83 134 87 547 364 392 169 521 139 439 225 459 130p 322 327 44 248 163 419 405 499 255 144 199 108 271 Complete the table, starting with the lowest class...
S O 1-The frequency distribution below was constructed from data collected from a group of 25...
 S O 1-The frequency distribution below was constructed from data collected from a group of 25 students. (15 points) SI Height (inches) Frequency Em 58-63 64-69 70-75 76-81 82-87 82-874 88-933 94-99 2 a. Construct a relative frequency distribution. b. Construct a cumulative frequency distribution c. Construct a cumulative relative frequency distribution. (just create a table for all the frequency distributions)
(9 marks) 6) The data below shows the mass of 40 students in class. The measurement...
 (9 marks) 6) The data below shows the mass of 40 students in class. The measurement is the nearest kg. 55 70 57 73 55 64 60 48 59 72 58 54 69 51 63 78 75 64 65 57 71 78 76 62 66 62 61 53 67 49 76 63 63 76 52 76 71 61 56 71 A) Construct a frequency distribution table with 7 classes for the data given above? B) Draw the histogram for the...
2.5 Self-quiz Problem (Discrete Data). The number of shot blocks of a certain basketball player had...
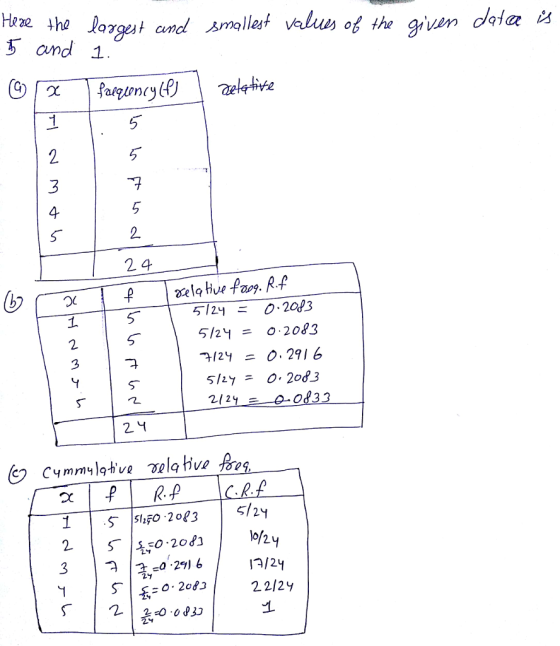
 2.5 Self-quiz Problem (Discrete Data). The number of shot blocks of a certain basketball player had in 24 randomly selected games is given as follows; {1,2,2,2,2,1,3,4,2,1,3,1 5,2,1,3,0,1,4,4,3,3,5,2} (1) Construct a table that gives the frequency distribution of this data. (2) Construct a table that gives the relative frequency distribution of this data. (3) Construct a frequency histogram of this data. (4) Construct a relative frequency histogram of this data. (5) Construct a stem and leaf plot for this data set....
construct a frequency distribution for the data set. Use the following table headings: class,frequency,midpoint,relative frequency,cumulative frequency...
construct a frequency distribution for the data set. Use the following table headings: class,frequency,midpoint,relative frequency,cumulative frequency Number of classes:5 Data set: Exam scores for all students in statistics class 83,92,94,82,73,98,78,85,72,90,89,92,96,89,75,85,63,47,75,82
Construct a frequency distribution for the given data set using 6 classes
 Construct a frequency distribution for the given data set using 6 classes. In the table, include the midpoints, relative frequencies, and cumulative frequencies. Which dass has the greatest frequency and which has the least frequency? Amount (in dollars) spent on books for a semester 414 449 495 435 333 511 262 463 264 78 217 322 240369 2880 474 382 163 40479 340 70 259 241 75 176 331 279 54 Complete the table, starting with the lowest dass limit. Use the minimum...
 Consider the following data set 14.8 7.2 8.7 9.6 13.1 13.8 7.5 10.1 9.9 9.9 11.9 4.7 14.8 8.1 10.6 3.8 4.6 12.5 7.9 6.6 10.3 13.3 7.26.8 7.3 7.2 8.7 5.2 5.2 13.1 Click here for the Excel Data File a. Construct the frequency distribution using classes of 3 up to 5, 5 up to 7, etc. Class Frequency 3 up to 5 5 up to 7 7 up to 9 9 up to 11 11 up to 13...
 Construct a frequency distribution for the given data set using 6 classes. In the table, include the midpoints, relative frequencies, and cumulative frequencies. Which class has the greatest frequency and which has the least frequency? Amount (in dollars) spent on books for a semester 118 228 309 289 413 518 331 46 389 72 89 133 357 415 3850 42 476 170 40 103 121 75 315 334 402 138 324 289 331 Complete the table, starting with the lowest...
 Construct a frequency distribution for the given data set using 6 classes. In the table, include the midpoints, relative frequencies, and cumulative frequencies. Which class has the greatest frequency and which has the least frequency? Amount (in dolars) spent on books for a semester 289 327 83 134 87 547 364 392 169 521 139 439 225 459 130p 322 327 44 248 163 419 405 499 255 144 199 108 271 Complete the table, starting with the lowest class...
 S O 1-The frequency distribution below was constructed from data collected from a group of 25 students. (15 points) SI Height (inches) Frequency Em 58-63 64-69 70-75 76-81 82-87 82-874 88-933 94-99 2 a. Construct a relative frequency distribution. b. Construct a cumulative frequency distribution c. Construct a cumulative relative frequency distribution. (just create a table for all the frequency distributions)
 (9 marks) 6) The data below shows the mass of 40 students in class. The measurement is the nearest kg. 55 70 57 73 55 64 60 48 59 72 58 54 69 51 63 78 75 64 65 57 71 78 76 62 66 62 61 53 67 49 76 63 63 76 52 76 71 61 56 71 A) Construct a frequency distribution table with 7 classes for the data given above? B) Draw the histogram for the...
 2.5 Self-quiz Problem (Discrete Data). The number of shot blocks of a certain basketball player had in 24 randomly selected games is given as follows; {1,2,2,2,2,1,3,4,2,1,3,1 5,2,1,3,0,1,4,4,3,3,5,2} (1) Construct a table that gives the frequency distribution of this data. (2) Construct a table that gives the relative frequency distribution of this data. (3) Construct a frequency histogram of this data. (4) Construct a relative frequency histogram of this data. (5) Construct a stem and leaf plot for this data set....
Most questions answered within 3 hours.
-
3. Which statement about nuclear fission is correct? (1
point)
A. Nuclear fission provides energy for...
asked 1 minute ago -
If a $2,000 increase in income leads to a $1,5000 increase in
consumption expenditures, then the...
asked 36 seconds ago -
May you please put this in layman's terms?
ABSTRACT
Coagulase-negative staphylococci (CoNS) and Staphylococcus
aureus are...
asked 5 minutes ago -
If authentic leadership is really a lifelong process,
can teenagers be authentic leaders? Why or why...
asked 21 minutes ago -
Six years of quarterly data of a seasonally adjusted series are
used to estimate a linear...
asked 39 minutes ago -
Which of the following is not an ecological model used
to foster behavior change?
PRECEDE-PROCEED Model...
asked 42 minutes ago -
On the Apollo 14 mission to the moon, astronaut Alan Shepard hit
a golf ball with...
asked 39 minutes ago -
What are John’s potential claims if he is terminated
this week?
John is a 54-year-old man...
asked 52 minutes ago -
A (8.5) cm tall object is placed at a distance of (14.2) cm from
a convex...
asked 1 hour ago -
(2) For the following questions, consider a data set that
exhibits a normal distribution. Report the...
asked 1 hour ago -
What exactly is an information system? How does it work" What
are its people organization,
...
asked 1 hour ago -
The Food Marketing Institute shows that 17% of households spend
more than $100 per week on...
asked 1 hour ago