
Homework Answers
d) the main advantage of the sample standard deviation over the
sample variance as a measure of variability is there biasness.
sample standard deviation is not biased.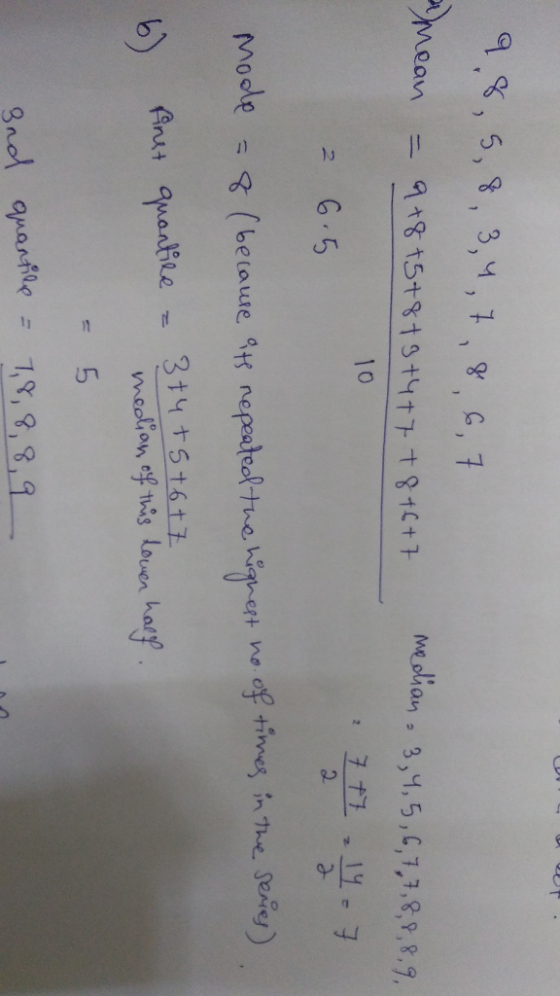


Add Answer to:
PART B: STATISTICS Question 1. The final exam marks for 10 students taking MPE781 are given...
1. A statistics instructor gives an exam where the students did not perform as well as...
1. A statistics instructor gives an exam where the students did not perform as well as expected. She wants to add 10 points to all student exams scores. If she does this, which of the following sample statistics would change? I. Mean II. Median III. Coefficient of Variation IV. Range V. Standard Deviation VI. Interquartile Range Options Only I,II and III Only I Only I,II and IV Only I and V All of them would change
The final exam scores of students taking a statistics course are normally distributed with a population...
 The final exam scores of students taking a statistics course are normally distributed with a population mean of 72 and a population standard deviation of 8. If a student taking this statistics course is randomly selected, what is the probability that his/her final exam score is between 60 and 84? A .4332 .9332 C .8664 .1336 Submit Answer
transpo oprtn and logistics managment/ please use excel Problem 11. (10 marks) The accompanying data are the travel...
 transpo oprtn and logistics managment/ please use excel
Problem 11. (10 marks) The accompanying data are the travel times (min) on an arterial street collected by ten test vehicles. Vehicle 5 6 7 1 2 3 4 9 10 16 10 1 22 Travel Time (min) 10 14 9 10 12 11 Use Excel for Analysis a. Calculate the values of the sample mean, median, and mode b. From the relative locations of the above summary statistics, can you conjecture...
transpo oprtn and logistics managment/ please use excel
Problem 11. (10 marks) The accompanying data are the travel times (min) on an arterial street collected by ten test vehicles. Vehicle 5 6 7 1 2 3 4 9 10 16 10 1 22 Travel Time (min) 10 14 9 10 12 11 Use Excel for Analysis a. Calculate the values of the sample mean, median, and mode b. From the relative locations of the above summary statistics, can you conjecture...
The following data were collected as part of a study of coffee consumption among medical students....
The following data were collected as part of a study of coffee consumption among medical students. The following reflect cups per day consumed: 3 4 6 8 2 1 0 2 First, put the data in order from lowest to highest: 0, 1, 2, 2, 3, 4, 6, 8 This will help you to find the median and the quartiles! 1) Compute the sample mean and round to one decimal place (see page 100). ____ 2) Compute the sample median...
The following data were collected as part of a study of coffee consumption among medical students....
 The following data were collected as part of a study of coffee consumption among medical students. The following reflect cups per day consumed: First, put the data in order from lowest to highest: 0, 1, 2, 2, 3, 4, 6, 8 This will help you to find the median and the quartiles 1) Compute the sample mean and round to one decimal place (see page 100), 2) Compute the sample median and round to one decimal place (see page 88)...
The following data were collected as part of a study of coffee consumption among medical students....
 The following data were collected as part of a study of coffee consumption among medical students. The following reflect cups per day consumed: First, put the data in order from lowest to highest: 0, 1, 2, 2, 3, 4, 6, 8 This will help you to find the median and the quartiles! 1) Compute the sample mean and round to ane decimal place (see page 100 2) Compute the sample median and round to one decimal place (see page 88)....
1. How would you interpret correlation coefficient of: -0.95? A. Not a good correlation measure B....
1. How would you interpret correlation coefficient of: -0.95? A. Not a good correlation measure B. Week negative correlation C. Strong negative correlatio D. Not enough information to determine correlation 2. What statistical measures are used for describing dispersion in data? How do they differ from one another? A. Range, variance, and standard deviation B. Mean absolute deviation C. Mean, median, and mode D. Mean, standard deviation, and interquartile range 3. What is the difference between a population and a...
1. Ten students compare their monthly rent. The rents for each of the students is presented...
 1. Ten students compare their monthly rent. The rents for each of the students is presented below. Y = {384,472,496,503, 527,548,549,554,683,750) a) What are the mean and the median of the rent prices? b) What are the sample variance, standard deviation, range and inter quartile range of the rent prices? c) Assume that rent prices follow a normal distribution. Given the observed sample of values and the mean and standard deviation you calculated above construct a 95% CI for the...
The following data are the ages (in years) at diagnosis for 20 patients under treatment for...
The following data are the ages (in years) at diagnosis for 20 patients under treatment for meningitis: 18 18 25 19 23 20 69 18 21 18 20 18 18 20 18 19 28 17 18 18 (a) Calculate and interpret the values of the sample mean, variance, and standard deviation. (b) Compute the sample median. Why might you recommend the sample median as a measure of center rather than the sample mean? (c) Compute the upper quartile, the lower...
Ch 03: Mastery Assignment - Descriptive Statistics: Numerical Measures < Back to Assignment Attempts: Average: 75...
 Ch 03: Mastery Assignment - Descriptive Statistics: Numerical Measures < Back to Assignment Attempts: Average: 75 6. Measures of variability Consider a data set containing the following values: 88 96 72 84 95 100 92 90 The smallest value is and the largest value is Therefore, the range is The first quartile is The third quartile is Therefore, the interquartile range (IQR) is The mean of the preceding values is 89.625. The deviations from the mean have been calculated: -1.625...
 The final exam scores of students taking a statistics course are normally distributed with a population mean of 72 and a population standard deviation of 8. If a student taking this statistics course is randomly selected, what is the probability that his/her final exam score is between 60 and 84? A .4332 .9332 C .8664 .1336 Submit Answer
 transpo oprtn and logistics managment/ please use excel
Problem 11. (10 marks) The accompanying data are the travel times (min) on an arterial street collected by ten test vehicles. Vehicle 5 6 7 1 2 3 4 9 10 16 10 1 22 Travel Time (min) 10 14 9 10 12 11 Use Excel for Analysis a. Calculate the values of the sample mean, median, and mode b. From the relative locations of the above summary statistics, can you conjecture...
transpo oprtn and logistics managment/ please use excel
Problem 11. (10 marks) The accompanying data are the travel times (min) on an arterial street collected by ten test vehicles. Vehicle 5 6 7 1 2 3 4 9 10 16 10 1 22 Travel Time (min) 10 14 9 10 12 11 Use Excel for Analysis a. Calculate the values of the sample mean, median, and mode b. From the relative locations of the above summary statistics, can you conjecture...
 The following data were collected as part of a study of coffee consumption among medical students. The following reflect cups per day consumed: First, put the data in order from lowest to highest: 0, 1, 2, 2, 3, 4, 6, 8 This will help you to find the median and the quartiles 1) Compute the sample mean and round to one decimal place (see page 100), 2) Compute the sample median and round to one decimal place (see page 88)...
 The following data were collected as part of a study of coffee consumption among medical students. The following reflect cups per day consumed: First, put the data in order from lowest to highest: 0, 1, 2, 2, 3, 4, 6, 8 This will help you to find the median and the quartiles! 1) Compute the sample mean and round to ane decimal place (see page 100 2) Compute the sample median and round to one decimal place (see page 88)....
 1. Ten students compare their monthly rent. The rents for each of the students is presented below. Y = {384,472,496,503, 527,548,549,554,683,750) a) What are the mean and the median of the rent prices? b) What are the sample variance, standard deviation, range and inter quartile range of the rent prices? c) Assume that rent prices follow a normal distribution. Given the observed sample of values and the mean and standard deviation you calculated above construct a 95% CI for the...
 Ch 03: Mastery Assignment - Descriptive Statistics: Numerical Measures < Back to Assignment Attempts: Average: 75 6. Measures of variability Consider a data set containing the following values: 88 96 72 84 95 100 92 90 The smallest value is and the largest value is Therefore, the range is The first quartile is The third quartile is Therefore, the interquartile range (IQR) is The mean of the preceding values is 89.625. The deviations from the mean have been calculated: -1.625...
Most questions answered within 3 hours.
-
A coach uses a new technique to train gymnasts. Seven
gymnasts were randomly selected and their...
asked 1 hour ago -
While rotating the tires on your car you notice a rock [mass =
0.1 Kg] stuck...
asked 3 hours ago -
Using MARS simulator, write MIPS programs according to
the following scenarios: Receive a positive integer number...
asked 5 hours ago -
An object in front of a concave mirror has a real image that is
11.5 cm...
asked 5 hours ago -
Consider the reaction, C3 H8 + O2 --> CO2 + H2O. How many
moles of O2...
asked 7 hours ago -
You and your opponent both roll a fair die. If you both roll the
same number,...
asked 7 hours ago -
In a study of the accuracy of fast food drive-through orders,
Restaurant A had 257 accurate...
asked 7 hours ago -
Identify and describe in detail the four categories of
institutions that could be included in a...
asked 7 hours ago -
In python
class Customer:
def __init__(self, customer_id, last_name, first_name, phone_number, address):
self._customer_id = int(customer_id)
self._last_name =...
asked 7 hours ago -
What is an example of a limitation in implementing a new
ERP system and how it...
asked 7 hours ago -
In a section of 9.7cm of an artery with a radius of 2.6mm there
is a...
asked 7 hours ago -
the two carboxylic acid groups of aspartic acid have different
acidities with pKa values of 2.1...
asked 7 hours ago