The above graph plots final velocity on the vertical axis and \frac{1}{elapsed\:time}1 e l a p s e d t i m e on the horizontal axis. It is easier to draw a Constant Acceleration Line (e.g., the two upwardly sloping lines) on this graph than it would be to draw a Constant Acceleration Line on a graph that used identical data, but had "elapsed time" on the horizontal axis, because:
A. Using
1elapsedtime gives you a straight Constant Acceleration
Line. Using Elapsed Time gives you a curved Constant Acceleration
Line.
B. Using Elapsed Time would cause some data points to be missing because they would be off of the scale of the chart
C. Using Elapsed Time produces a chart whose data points vary randomly, so no Constant Acceleration Line can be drawn which would describe their behavior.
Homework Answers
The data are varying with respect to time since no constant acceleration can be drawn on the plot. For solving these data regression method is used. Option C is correct.
Add Answer to:
The above graph plots final velocity on the vertical axis and
\frac{1}{elapsed\:time}1 e l a p...
1. Which graph best describes the "horizontal distance traveled" (vertical axis) versus the tim elapsed (horizontal...
 1. Which graph best describes the "horizontal distance traveled" (vertical axis) versus the tim elapsed (horizontal axis) for a car traveling at a constant speed of 60 miles per hour? Write down the letter and then justify your answer in a complete sentence Horizontal Position of Car (in miles) Answer: 240 Bapsed Time in hours) 120 2. (a) Sketch the speed in milòs per hour (mi/ h) versus time in hours for Problem #1. on - Speed of Car (miles...
on a distance/time graph...y axis being distance and x axis being time.....what would a vertical straight...
on a distance/time graph...y axis being distance and x axis being time.....what would a vertical straight line, up and down represent a. constant distance b. constant time, c constant speed, d. constant acceleration, or e. nothing is constant
on a distance/time graph...y axis being distance and x axis being time.....what would a straight line...
on a distance/time graph...y axis being distance and x axis being time.....what would a straight line , neither horizontal nor vertical represent (/) a. constant distance b. constant time, c constant speed, d. constant acceleration, or e. nothing is constant
In the given figure, the horizontal axis is the elapsed time with each box as 0.5...
 In the given figure, the horizontal axis is the elapsed time
with each box as 0.5 second. First, assume that the vertical axis
is the displacement x with each box representing 0.25
meters.
a) Figure out the displacement magnitude of instantaneous
velocity at point B.
b)In which region(s), if any does the object have negative Vx?
Why?
c) Calculate the average velocity Vx between points D and F.
Now, assume that the vertical axis shows the velocity
Vx, with each...
In the given figure, the horizontal axis is the elapsed time
with each box as 0.5 second. First, assume that the vertical axis
is the displacement x with each box representing 0.25
meters.
a) Figure out the displacement magnitude of instantaneous
velocity at point B.
b)In which region(s), if any does the object have negative Vx?
Why?
c) Calculate the average velocity Vx between points D and F.
Now, assume that the vertical axis shows the velocity
Vx, with each...
please graph this and answer the 2 questions below use the data above to plot a...
 please graph this and answer the 2 questions below
use the data above to plot a graph of light intensity
versus rate of photosynthesis.
etrum Graph of Spinach Chloroplast Extract 0.41 sle 1: Effect of Light Intensity on the Rate of Photosynthesis (Time should be in minutes, not minutes & seconds) Light Elapsed time Elapsed time Rate of Photosynthesis Intensity (minutes seconds) (minutes) ml. o (ml /hour) 45 watts 25 min 15 sec 25.25min 0.1 0.24 75 watts 14 min...
please graph this and answer the 2 questions below
use the data above to plot a graph of light intensity
versus rate of photosynthesis.
etrum Graph of Spinach Chloroplast Extract 0.41 sle 1: Effect of Light Intensity on the Rate of Photosynthesis (Time should be in minutes, not minutes & seconds) Light Elapsed time Elapsed time Rate of Photosynthesis Intensity (minutes seconds) (minutes) ml. o (ml /hour) 45 watts 25 min 15 sec 25.25min 0.1 0.24 75 watts 14 min...
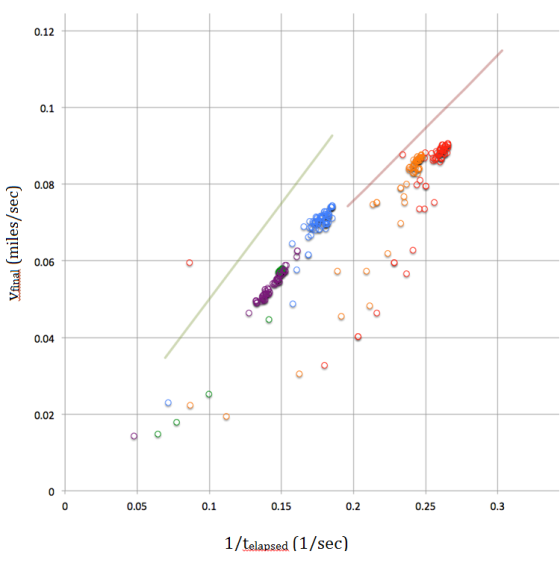
In the graph of actual dragster data, most of the dots are below and to the...
 In the graph of actual dragster data, most of the dots are below
and to the right of the constant acceleration line. This is
because:
A. The dragster's acceleration was constant, causing its speed
to increase as time passed.
B. The dragster's acceleration increased as time passed.
C. The dragster's acceleration decreased as time passed.
D. The dragster's acceleration was constant, causing its speed
to decrease as time passed.
0.12 0.08 Oo Vfinal (miles/sec) 0.04 0.02 0 0.05 0.1 0.15...
In the graph of actual dragster data, most of the dots are below
and to the right of the constant acceleration line. This is
because:
A. The dragster's acceleration was constant, causing its speed
to increase as time passed.
B. The dragster's acceleration increased as time passed.
C. The dragster's acceleration decreased as time passed.
D. The dragster's acceleration was constant, causing its speed
to decrease as time passed.
0.12 0.08 Oo Vfinal (miles/sec) 0.04 0.02 0 0.05 0.1 0.15...
Refer to the following graph to answer the next five questions: Vertical Axis Horizontal Axis Assuming...
 Refer to the following graph to answer the next five questions: Vertical Axis Horizontal Axis Assuming the figure represents the market for loanable funds, it would be true that the vertical axis represents the interest rate, and the distance between points C and D represents the surplus of loanable funds at interest rate A. o line 1 represents the interest rate, and line 2 represents the quantity of savings. the vertical axis represents the quantity of funds lent and borrowed,...
need help on this graph Physies 195 - Straight-line kinematics Data: Dot period=1/10s: the time interval...
 need help on this graph
Physies 195 - Straight-line kinematics Data: Dot period=1/10s: the time interval between dots is 0.100 corrected values] 15 16 Xc (cm) te(s) 6 7 0 12 3 14. X(cm) t(s) đa (cm) | V (cm/s) 0 0 2.18 0.1002 .182 .0 4.890.200 12.7127.00 2. 5 0.30 3.67 36.70 12.88 o.quo 4.32 430 f 9.95 O S 10 .20 zich were 1 1 tbalo 30,56 38.0 74.50 46.43 0.900 8.8 84.43 55-25 88.00 1101.30 65.39 1.100...
need help on this graph
Physies 195 - Straight-line kinematics Data: Dot period=1/10s: the time interval between dots is 0.100 corrected values] 15 16 Xc (cm) te(s) 6 7 0 12 3 14. X(cm) t(s) đa (cm) | V (cm/s) 0 0 2.18 0.1002 .182 .0 4.890.200 12.7127.00 2. 5 0.30 3.67 36.70 12.88 o.quo 4.32 430 f 9.95 O S 10 .20 zich were 1 1 tbalo 30,56 38.0 74.50 46.43 0.900 8.8 84.43 55-25 88.00 1101.30 65.39 1.100...
The dependent variable is the position (y-axis) and the independent variable is the time (x-axis). This...
The dependent variable is the position (y-axis) and the independent variable is the time (x-axis). This is the measured position of a rock as it falls from the top of a very high cliff and obeys the equations y = 1/2gt2. Make sure you label the plot properly. Right click on a data point in the graph and add a “Trend line.” Select a polynomial of order 2. This is a parabolic equation and describes an object falling under constant...
2. Calculate the velocity at each time (except the first and the last one) by using values immedi...
 2. Calculate the velocity at each time (except the first and the last one) by using values immediately after and before those times: the tn-- For example, the velocity at point 2 is n Time t (s) Position x (m) Velocity v (m/s) vt (unit-mls) aGou .245 8 3,abus 1.553 3. calculate v/t (what are the units?) and write it in column 5 of the table above. Calculate its average and its uncertainty: Average uncertainty: 4. On the graph paper,...
 1. Which graph best describes the "horizontal distance traveled" (vertical axis) versus the tim elapsed (horizontal axis) for a car traveling at a constant speed of 60 miles per hour? Write down the letter and then justify your answer in a complete sentence Horizontal Position of Car (in miles) Answer: 240 Bapsed Time in hours) 120 2. (a) Sketch the speed in milòs per hour (mi/ h) versus time in hours for Problem #1. on - Speed of Car (miles...
 In the given figure, the horizontal axis is the elapsed time
with each box as 0.5 second. First, assume that the vertical axis
is the displacement x with each box representing 0.25
meters.
a) Figure out the displacement magnitude of instantaneous
velocity at point B.
b)In which region(s), if any does the object have negative Vx?
Why?
c) Calculate the average velocity Vx between points D and F.
Now, assume that the vertical axis shows the velocity
Vx, with each...
In the given figure, the horizontal axis is the elapsed time
with each box as 0.5 second. First, assume that the vertical axis
is the displacement x with each box representing 0.25
meters.
a) Figure out the displacement magnitude of instantaneous
velocity at point B.
b)In which region(s), if any does the object have negative Vx?
Why?
c) Calculate the average velocity Vx between points D and F.
Now, assume that the vertical axis shows the velocity
Vx, with each...
 please graph this and answer the 2 questions below
use the data above to plot a graph of light intensity
versus rate of photosynthesis.
etrum Graph of Spinach Chloroplast Extract 0.41 sle 1: Effect of Light Intensity on the Rate of Photosynthesis (Time should be in minutes, not minutes & seconds) Light Elapsed time Elapsed time Rate of Photosynthesis Intensity (minutes seconds) (minutes) ml. o (ml /hour) 45 watts 25 min 15 sec 25.25min 0.1 0.24 75 watts 14 min...
please graph this and answer the 2 questions below
use the data above to plot a graph of light intensity
versus rate of photosynthesis.
etrum Graph of Spinach Chloroplast Extract 0.41 sle 1: Effect of Light Intensity on the Rate of Photosynthesis (Time should be in minutes, not minutes & seconds) Light Elapsed time Elapsed time Rate of Photosynthesis Intensity (minutes seconds) (minutes) ml. o (ml /hour) 45 watts 25 min 15 sec 25.25min 0.1 0.24 75 watts 14 min...
 In the graph of actual dragster data, most of the dots are below
and to the right of the constant acceleration line. This is
because:
A. The dragster's acceleration was constant, causing its speed
to increase as time passed.
B. The dragster's acceleration increased as time passed.
C. The dragster's acceleration decreased as time passed.
D. The dragster's acceleration was constant, causing its speed
to decrease as time passed.
0.12 0.08 Oo Vfinal (miles/sec) 0.04 0.02 0 0.05 0.1 0.15...
In the graph of actual dragster data, most of the dots are below
and to the right of the constant acceleration line. This is
because:
A. The dragster's acceleration was constant, causing its speed
to increase as time passed.
B. The dragster's acceleration increased as time passed.
C. The dragster's acceleration decreased as time passed.
D. The dragster's acceleration was constant, causing its speed
to decrease as time passed.
0.12 0.08 Oo Vfinal (miles/sec) 0.04 0.02 0 0.05 0.1 0.15...
 Refer to the following graph to answer the next five questions: Vertical Axis Horizontal Axis Assuming the figure represents the market for loanable funds, it would be true that the vertical axis represents the interest rate, and the distance between points C and D represents the surplus of loanable funds at interest rate A. o line 1 represents the interest rate, and line 2 represents the quantity of savings. the vertical axis represents the quantity of funds lent and borrowed,...
 need help on this graph
Physies 195 - Straight-line kinematics Data: Dot period=1/10s: the time interval between dots is 0.100 corrected values] 15 16 Xc (cm) te(s) 6 7 0 12 3 14. X(cm) t(s) đa (cm) | V (cm/s) 0 0 2.18 0.1002 .182 .0 4.890.200 12.7127.00 2. 5 0.30 3.67 36.70 12.88 o.quo 4.32 430 f 9.95 O S 10 .20 zich were 1 1 tbalo 30,56 38.0 74.50 46.43 0.900 8.8 84.43 55-25 88.00 1101.30 65.39 1.100...
need help on this graph
Physies 195 - Straight-line kinematics Data: Dot period=1/10s: the time interval between dots is 0.100 corrected values] 15 16 Xc (cm) te(s) 6 7 0 12 3 14. X(cm) t(s) đa (cm) | V (cm/s) 0 0 2.18 0.1002 .182 .0 4.890.200 12.7127.00 2. 5 0.30 3.67 36.70 12.88 o.quo 4.32 430 f 9.95 O S 10 .20 zich were 1 1 tbalo 30,56 38.0 74.50 46.43 0.900 8.8 84.43 55-25 88.00 1101.30 65.39 1.100...
 2. Calculate the velocity at each time (except the first and the last one) by using values immediately after and before those times: the tn-- For example, the velocity at point 2 is n Time t (s) Position x (m) Velocity v (m/s) vt (unit-mls) aGou .245 8 3,abus 1.553 3. calculate v/t (what are the units?) and write it in column 5 of the table above. Calculate its average and its uncertainty: Average uncertainty: 4. On the graph paper,...
Most questions answered within 3 hours.
-
The mean waiting time at the drive-through of a fast-food
restaurant from the time an order...
asked 6 minutes ago -
The pitch (p) of a helix is defined as p = dn, in which n is...
asked 8 minutes ago -
Do you agree that the declining stock of social capital is the
blame for the failure...
asked 12 minutes ago -
A researcher is interested in whether coffee consumption helps
with performance on reading comprehension tasks. The...
asked 21 minutes ago -
it has been estimated since the beginning of the human race that
about 133 metric ton...
asked 27 minutes ago -
Where must Medicare prescription drug plans allow for
participants to fill their prescriptions?
asked 30 minutes ago -
Five moles of monatomic ideal gas have initial pressure 2.50 ×
103 Pa and initial volume...
asked 45 minutes ago -
A resistor and the capacitor are used to control the timing in
the RC circuit of...
asked 44 minutes ago -
Living in a group could bring several disadvantages to an
individual. What are some of the...
asked 1 hour ago -
Complete and balance the following reactions. In case of no
reaction occurring write NR.
Mix #1:...
asked 1 hour ago -
If an economy consumes 75% of any increase in income, then an
increase in autonomous investment...
asked 1 hour ago -
A shotputter throws the shot with an initial speed of 15.8 m/s
at a 38.0 ∘...
asked 1 hour ago