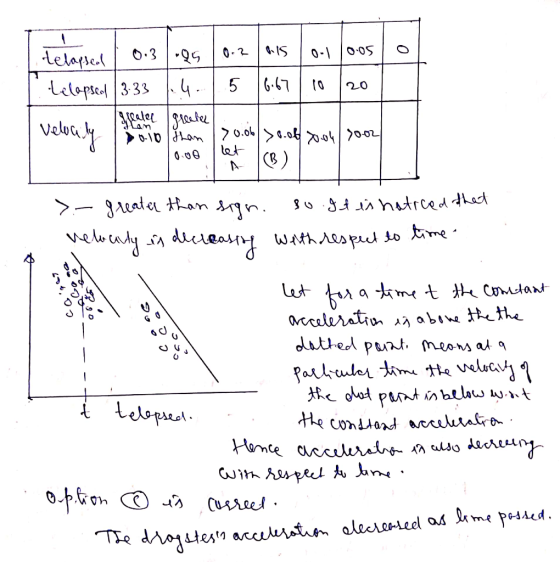
In the graph of actual dragster data, most of the dots are below and to the right of the constant acceleration line. This is because:
A. The dragster's acceleration was constant, causing its speed to increase as time passed.
B. The dragster's acceleration increased as time passed.
C. The dragster's acceleration decreased as time passed.
D. The dragster's acceleration was constant, causing its speed
to decrease as time passed.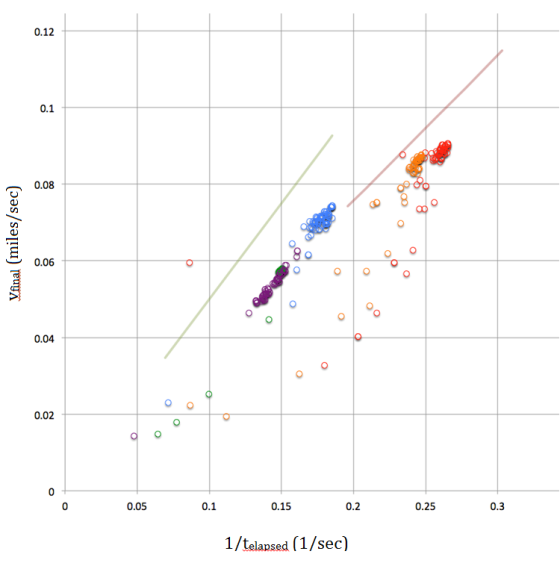
Homework Answers
Add Answer to:
In the graph of actual dragster data, most of the dots are below and to the...
The above graph plots final velocity on the vertical axis and \frac{1}{elapsed\:time}1 e l a p...
 The above graph plots final velocity on the vertical axis and
\frac{1}{elapsed\:time}1 e l a p s e d t i m e on the horizontal
axis. It is easier to draw a Constant Acceleration Line (e.g., the
two upwardly sloping lines) on this graph than it would be to draw
a Constant Acceleration Line on a graph that used identical data,
but had "elapsed time" on the horizontal axis, because:
A. Using
1elapsedtime gives you a straight Constant Acceleration
Line....
The above graph plots final velocity on the vertical axis and
\frac{1}{elapsed\:time}1 e l a p s e d t i m e on the horizontal
axis. It is easier to draw a Constant Acceleration Line (e.g., the
two upwardly sloping lines) on this graph than it would be to draw
a Constant Acceleration Line on a graph that used identical data,
but had "elapsed time" on the horizontal axis, because:
A. Using
1elapsedtime gives you a straight Constant Acceleration
Line....
2) Shown below is the velocity graph of a lg coffee filter released from rest. (Note...
 2) Shown below is the velocity graph of a lg coffee filter released from rest. (Note the break in the time axis.) Four distinct intervals are shown on the graph. a) Speed downward increasing from rest, Os <t<0.02s. b) Speed downward increasing, 0.02s sis 0.09. c) Speed downward is constant, 0.098 <134.99s. d) Landing on the floor, 4.995 <155.00s. Draw an acceleration graph for the same time intervals above. You may use the tangent lines drawn on the velocity graph...
Atwood Machine Data M=5883kg M2= 5874kg mr 0086kg M M Accel Rider .02 .04 .06 .08...
 Atwood Machine Data M=5883kg M2= 5874kg mr 0086kg M M Accel Rider .02 .04 .06 .08 .1 Avg. Accel .1623 .3261 -.4732 .6286 .7652 (M2) Mass Ratio .0166 .0326 .0482 .0633 .0779 (M,+my+m.)s Acceleration vs. Mass Ratio 08 0.6 Acceleration (m/s) 0.4 02 0 o 0.02 0.08 0.1 0.04 0.06 Mass Ratio • When the system is put into motion, the velocity vs. time graph that was obtained is below. Given this graph, describe the motion of the falling mass....
Figure below shows the time response of the system mechanical figure above to a force in step of 8.5 N. Following the...
 Figure below shows the time response of the system mechanical figure above to a force in step of 8.5 N.
Following the analysis of the system in the figure above
a) Determine the transfer function X(s)/F(s) of the system and give the standard form of the latter.
b) Based on the response of this system at 8.5 N, determine the , and parameters of the mechanical system.
c) By combining the results found previously, determine the value of the three...
Figure below shows the time response of the system mechanical figure above to a force in step of 8.5 N.
Following the analysis of the system in the figure above
a) Determine the transfer function X(s)/F(s) of the system and give the standard form of the latter.
b) Based on the response of this system at 8.5 N, determine the , and parameters of the mechanical system.
c) By combining the results found previously, determine the value of the three...
Questions 1. Given the H NMR spectrum and molec- ular formula for each of the following compounds, deduce the...
 Questions 1. Given the H NMR spectrum and molec- ular formula for each of the following compounds, deduce the structure of the compound, estimate the chemical shifts of all its protons using the parameters in Tables 22.3–22.5, and assign the NMR sig- nals to their respective protons. (a) C.H,,Cl; 1H NMR (CDC12): 8 3.33 (2H, s); 1.10 (9H, s) (b) C-H,,0,; 1H NMR (CDC12): 8 3.88 (1H, s); 2.25 (3H, s); 1.40 (6H, s) (C) CH,,0,; 1H NMR (CDC1,): 8...
Lori Jeffrey is a successful sales representative for a major publisher of college textbooks. Historically, Lori...
 Lori Jeffrey is a successful sales representative for a major publisher of college textbooks. Historically, Lori obtains a book adoption on 30% of her sales calls. Viewing her sales calls for one month as a sample of all possible sales calls, assume that a statistical analysis of the data yields a standard error of the proportion of 0.0450. User-table. a. How large was the sample used in this analysis? That is, how many sales calls did Lori make during the...
[Qe-Home/Lab -] From a swinging pendulum of m = 0.5Kg and length L = 0.6m (small...
 [Qe-Home/Lab -] From a swinging pendulum of m = 0.5Kg and length L = 0.6m (small angle approx.) complete the following tasks: (get it data from here, use speed data only) Qua) Compare the theoretical and observed pendulum's period (T) Qab) Estimate the maximum displacement angle. Show work. fx D E F B 1 2 3 4 5 6 7 8 9 10 11 12 Run #13 Run #13 Run #13 Run #13 Position (m) Velocity (m/s) Acceleration (Force (N)...
The six-bus system shown in Figure 1 will be simulated using MATLAB. Transmission line data and b...
 The six-bus system shown in Figure 1 will be simulated using MATLAB. Transmission line data and bus data are given in Tables 1 and 2 respectively. The transmission line data are calculated on 100 MVA base and 230 (line-to-line) kV base for generator. Tasks: 1. Determine the network admittance matrix Y 2. Find the load flow solution using Gauss-Seidel/Newton Raphson method until first iteration by manual calculation. Use Maltab software to solve power flow problem using Gauss-Seidel method. Find the...
The rigid body shown below rotates around a fixed axis at O and position angle 0=...
 The rigid body shown below rotates around a fixed axis at O and position angle 0= 0 when the body is in static equilibrium. Force f(t) is applied to the body as shown below. The mass of the body is 12 kg and O is the center of mass. k=1000 N/m_for the spring. Mass moment of inertia I and damping constant c are to be determined. The plot below shows the response 0(t) when f(t) = 60 N is a...
Use the following data: AR AC A P 0.51 0.5 0.16 0.58 0.58 0.3 0.1 0.12...
Use the following data: AR AC A P 0.51 0.5 0.16 0.58 0.58 0.3 0.1 0.12 0.52 0.47 0.2 0.62 0.47 0.36 0.29 0.43 0.61 0.39 -0.14 0.26 0 0.22 0.18 0.5 0.32 0.2 -0.35 0.44 0.53 0.21 0.31 0.2 0.5 0.15 0.16 0.42 0.46 0.1 0.04 0.43 0.34 0.02 -0.25 0.4 Researchers want to know if coffee or some other form of stimulation really allows a person suffering from alcohol intoxication to ‘‘sober-up’’? A sample of 44 male college...
 The above graph plots final velocity on the vertical axis and
\frac{1}{elapsed\:time}1 e l a p s e d t i m e on the horizontal
axis. It is easier to draw a Constant Acceleration Line (e.g., the
two upwardly sloping lines) on this graph than it would be to draw
a Constant Acceleration Line on a graph that used identical data,
but had "elapsed time" on the horizontal axis, because:
A. Using
1elapsedtime gives you a straight Constant Acceleration
Line....
The above graph plots final velocity on the vertical axis and
\frac{1}{elapsed\:time}1 e l a p s e d t i m e on the horizontal
axis. It is easier to draw a Constant Acceleration Line (e.g., the
two upwardly sloping lines) on this graph than it would be to draw
a Constant Acceleration Line on a graph that used identical data,
but had "elapsed time" on the horizontal axis, because:
A. Using
1elapsedtime gives you a straight Constant Acceleration
Line....
 2) Shown below is the velocity graph of a lg coffee filter released from rest. (Note the break in the time axis.) Four distinct intervals are shown on the graph. a) Speed downward increasing from rest, Os <t<0.02s. b) Speed downward increasing, 0.02s sis 0.09. c) Speed downward is constant, 0.098 <134.99s. d) Landing on the floor, 4.995 <155.00s. Draw an acceleration graph for the same time intervals above. You may use the tangent lines drawn on the velocity graph...
 Atwood Machine Data M=5883kg M2= 5874kg mr 0086kg M M Accel Rider .02 .04 .06 .08 .1 Avg. Accel .1623 .3261 -.4732 .6286 .7652 (M2) Mass Ratio .0166 .0326 .0482 .0633 .0779 (M,+my+m.)s Acceleration vs. Mass Ratio 08 0.6 Acceleration (m/s) 0.4 02 0 o 0.02 0.08 0.1 0.04 0.06 Mass Ratio • When the system is put into motion, the velocity vs. time graph that was obtained is below. Given this graph, describe the motion of the falling mass....
 Figure below shows the time response of the system mechanical figure above to a force in step of 8.5 N.
Following the analysis of the system in the figure above
a) Determine the transfer function X(s)/F(s) of the system and give the standard form of the latter.
b) Based on the response of this system at 8.5 N, determine the , and parameters of the mechanical system.
c) By combining the results found previously, determine the value of the three...
Figure below shows the time response of the system mechanical figure above to a force in step of 8.5 N.
Following the analysis of the system in the figure above
a) Determine the transfer function X(s)/F(s) of the system and give the standard form of the latter.
b) Based on the response of this system at 8.5 N, determine the , and parameters of the mechanical system.
c) By combining the results found previously, determine the value of the three...
 Questions 1. Given the H NMR spectrum and molec- ular formula for each of the following compounds, deduce the structure of the compound, estimate the chemical shifts of all its protons using the parameters in Tables 22.3–22.5, and assign the NMR sig- nals to their respective protons. (a) C.H,,Cl; 1H NMR (CDC12): 8 3.33 (2H, s); 1.10 (9H, s) (b) C-H,,0,; 1H NMR (CDC12): 8 3.88 (1H, s); 2.25 (3H, s); 1.40 (6H, s) (C) CH,,0,; 1H NMR (CDC1,): 8...
 Lori Jeffrey is a successful sales representative for a major publisher of college textbooks. Historically, Lori obtains a book adoption on 30% of her sales calls. Viewing her sales calls for one month as a sample of all possible sales calls, assume that a statistical analysis of the data yields a standard error of the proportion of 0.0450. User-table. a. How large was the sample used in this analysis? That is, how many sales calls did Lori make during the...
 [Qe-Home/Lab -] From a swinging pendulum of m = 0.5Kg and length L = 0.6m (small angle approx.) complete the following tasks: (get it data from here, use speed data only) Qua) Compare the theoretical and observed pendulum's period (T) Qab) Estimate the maximum displacement angle. Show work. fx D E F B 1 2 3 4 5 6 7 8 9 10 11 12 Run #13 Run #13 Run #13 Run #13 Position (m) Velocity (m/s) Acceleration (Force (N)...
 The six-bus system shown in Figure 1 will be simulated using MATLAB. Transmission line data and bus data are given in Tables 1 and 2 respectively. The transmission line data are calculated on 100 MVA base and 230 (line-to-line) kV base for generator. Tasks: 1. Determine the network admittance matrix Y 2. Find the load flow solution using Gauss-Seidel/Newton Raphson method until first iteration by manual calculation. Use Maltab software to solve power flow problem using Gauss-Seidel method. Find the...
 The rigid body shown below rotates around a fixed axis at O and position angle 0= 0 when the body is in static equilibrium. Force f(t) is applied to the body as shown below. The mass of the body is 12 kg and O is the center of mass. k=1000 N/m_for the spring. Mass moment of inertia I and damping constant c are to be determined. The plot below shows the response 0(t) when f(t) = 60 N is a...
Most questions answered within 3 hours.
-
I was looking for help with a computer science c programming
class. not c++
This program...
asked 15 minutes ago -
Albinism is an autosomal recessive condition characterized by
absence of melanin pigment from the skin, eye...
asked 5 minutes ago -
Suppose you're looking at a physics example online, and come
across this expression in the middle...
asked 13 minutes ago -
Compile a list (7 or more) of other commands useful for
navigating or manipulating the UNIX/Linux...
asked 23 minutes ago -
How many grams of PbBr2 will precipitate when excess CrBr3
solution is added to 61.0 mL...
asked 25 minutes ago -
If I was given the address of 134.15.0.0/16 from my ISP and I
wanted to use...
asked 30 minutes ago -
What is the pH of the solution that results of dissolving 1.74g
of sodium hydroxide in...
asked 34 minutes ago -
Given a standardized normal distribution (with μ = 0 and a σ =
1), what is...
asked 1 hour ago -
Given the following information:
acetic acid
CH3COOH
Ka = 1.8×10⁻⁵
triethylamine
(C2H5)3N
Kb = 5.2×10⁻⁴
(1)...
asked 57 minutes ago -
Potassium permanganate(KMNO4)is has a solubility of 6.4 g/ 100 g
of water at 20ºC, and 250...
asked 54 minutes ago -
51.
As the marginal propensity to expend rises, the multiplier:
decreases.
is impossible to determine.
increases....
asked 1 hour ago -
The Baldwin Company currently has the following balances on their
balance sheet:
Total
Liabilities
$69,309
Common...
asked 1 hour ago