Solve the following: 1. A student wonders if tall women tend to date taller men than...
Solve the following:
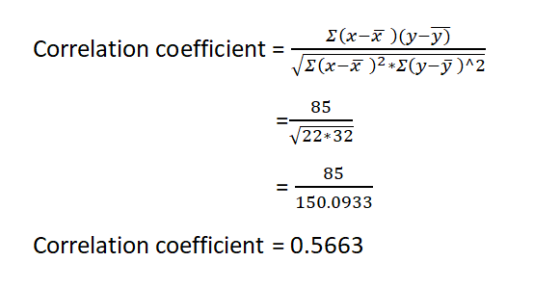
1. A student wonders if tall women tend to date taller men than shorter women do.
Here are the heights in inches of 6 randomly selected couples.
Women (X) 66 64 66 65 70 65
Men (Y) 72 68 70 68 71 65
Calculate the Correlation Coefficient
Homework Answers

Add Answer to:
Solve the following:
1. A student wonders if tall women
tend to date taller men than...
64 72 1. A college student wonders if tall women tend to date taller men than...
 64 72 1. A college student wonders if tall women tend to date taller men than do short women. She measures herself, her dormitory roommate, and the women in the adjoining rooms; then she measures the next man each woman dates. Here are the data (heights in inches): Women (x): 66 66 65 70 65 Men (y): 68 70 68 71 65 a. Make a scatter plot (using technology) of thele data. Based on the scatter plot, do you expect...
need help 8) (18 points) A student wonders if tall women tend to date taller men...
 need help
8) (18 points) A student wonders if tall women tend to date taller men than do short women. She randomly selected couples from her school. Here are the data (heights in inches): (remember to do ALL parts) Women Men 62 71 68 67 67 71 69 70 71 68 71 69 a. Do these data provide convincing evidence of a linear relationship between the height of women and men that are dating? Carry out a significance test at...
need help
8) (18 points) A student wonders if tall women tend to date taller men than do short women. She randomly selected couples from her school. Here are the data (heights in inches): (remember to do ALL parts) Women Men 62 71 68 67 67 71 69 70 71 68 71 69 a. Do these data provide convincing evidence of a linear relationship between the height of women and men that are dating? Carry out a significance test at...
45 points I A student wonders if tall women tend to date taller men than do...
 45 points I A student wonders if tall women tend to date taller men than do short women. She measures herself, her dormitory roommate, and the women in the adjoining rooms; then she measures the next man each woman dates. The data (heights in inches) are listed below Women (x) 67 65 68 62 72 65 Men (v) 71 67 72 69 68 64 (a) Make a scatterplot of these data. (Do this on paper. Your instructor may ask you...
8. The men in the previous example married six women of heights: 64, 68, 70, 66,...
 8. The men in the previous example married six women of heights: 64, 68, 70, 66, 67, and 65 inches, respectively. a) Find the mean, median and variance in heights for the women. bFor each individual couple there is a difference in height. Find the mean of these differences
A randomly selected sample of college baseball players has the following heights in inches. 68, 63,...
A randomly selected sample of college baseball players has the following heights in inches. 68, 63, 66, 63, 68, 63, 65, 66, 65, 67, 65, 65, 69, 71, 65, 70, 61, 66, 69, 62, 65, 64, 70, 63, 71, 63, 68, 68, 62, 71, 62, 65 Compute a 95% confidence interval for the population mean height of college baseball players based on this sample and fill in the blanks appropriately. < μ < (Keep 3 decimal places)
A randomly selected sample of college football players has the following heights in inches. 67, 63,...
A randomly selected sample of college football players has the following heights in inches. 67, 63, 66, 63, 62, 63, 62, 65, 69, 61, 68, 63, 64, 68, 66, 64, 66, 70, 68, 65, 62, 66, 68, 62, 67, 66, 70, 71, 62, 64, 67, 62 Compute a 99% confidence interval for the population mean height of college football players based on this sample and fill in the blanks appropriately. A= ___< μ <___ (Keep 3 decimal places)
Listed below are heights (in inches) and weight (in pounds) of randomly selected adult females subjects...
 Listed below are heights (in inches) and weight (in pounds) of
randomly selected adult females subjects from the California Health
Interview Survey
3) Listed below are heights (in inches) and weight (in pounds) of randomly selected adult female subjects from the California Health Interview Survey. Height 67 64 65 61 68 61 61 65 59 70 59 63 66 64 Weight 140 228 160 130 140 135 118 135 162 201 110 150 215 125 (a) Use a 0.05 significance...
Listed below are heights (in inches) and weight (in pounds) of
randomly selected adult females subjects from the California Health
Interview Survey
3) Listed below are heights (in inches) and weight (in pounds) of randomly selected adult female subjects from the California Health Interview Survey. Height 67 64 65 61 68 61 61 65 59 70 59 63 66 64 Weight 140 228 160 130 140 135 118 135 162 201 110 150 215 125 (a) Use a 0.05 significance...
A sample of 10 adult men gave the following data on their heights and weights. Height...
A sample of 10 adult men gave the following data on their heights and weights. Height (inches) X 62 62 63 65 66 67 68 68 70 72 Weight (pounds) Y 120 140 130 150 142 130 135 175 149 168 a. Generate the scatter plot of this data and graph the regression line in your plot. Include a picture of this graph and explain your impression of how well the line fits the data. b. State the equation of...
A sample of 10 adult men gave the following data on their heights and weights. Height...
A sample of 10 adult men gave the following data on their heights and weights. Height (inches) X 62 62 63 65 66 67 68 68 70 72 Weight (pounds) Y 120 140 130 150 142 130 135 175 149 168 (2 points) Generate the scatter plot of this data and graph the regression line in your plot. Include a picture of this graph and explain your impression of how well the line fits the data. The X is the...
Homework _ (201901-MAT258-8 × ㅮ Continue: Homework 1-1-(201 × ㅮ Take Test Homework 1-1-(2013 × ㅮ...
 Homework _ (201901-MAT258-8 × ㅮ Continue: Homework 1-1-(201 × ㅮ Take Test Homework 1-1-(2013 × ㅮ Courses " Blackboard Learn × 1 + → C 을 https:/ oswego open sunyedu/webapps/assessment/take takejsp?course assessment, d- 71097 1&course id-3103_1&content d 1112195 1&question num 5 ☆ E or Close Window Save and Submit Click Submit to complete this assessment Question 5 of Question5 4 points Save Answer Data obtained from the National Center for Health Statistics show that men between the ages of 20...
 64 72 1. A college student wonders if tall women tend to date taller men than do short women. She measures herself, her dormitory roommate, and the women in the adjoining rooms; then she measures the next man each woman dates. Here are the data (heights in inches): Women (x): 66 66 65 70 65 Men (y): 68 70 68 71 65 a. Make a scatter plot (using technology) of thele data. Based on the scatter plot, do you expect...
 need help
8) (18 points) A student wonders if tall women tend to date taller men than do short women. She randomly selected couples from her school. Here are the data (heights in inches): (remember to do ALL parts) Women Men 62 71 68 67 67 71 69 70 71 68 71 69 a. Do these data provide convincing evidence of a linear relationship between the height of women and men that are dating? Carry out a significance test at...
need help
8) (18 points) A student wonders if tall women tend to date taller men than do short women. She randomly selected couples from her school. Here are the data (heights in inches): (remember to do ALL parts) Women Men 62 71 68 67 67 71 69 70 71 68 71 69 a. Do these data provide convincing evidence of a linear relationship between the height of women and men that are dating? Carry out a significance test at...
 45 points I A student wonders if tall women tend to date taller men than do short women. She measures herself, her dormitory roommate, and the women in the adjoining rooms; then she measures the next man each woman dates. The data (heights in inches) are listed below Women (x) 67 65 68 62 72 65 Men (v) 71 67 72 69 68 64 (a) Make a scatterplot of these data. (Do this on paper. Your instructor may ask you...
 8. The men in the previous example married six women of heights: 64, 68, 70, 66, 67, and 65 inches, respectively. a) Find the mean, median and variance in heights for the women. bFor each individual couple there is a difference in height. Find the mean of these differences
 Listed below are heights (in inches) and weight (in pounds) of
randomly selected adult females subjects from the California Health
Interview Survey
3) Listed below are heights (in inches) and weight (in pounds) of randomly selected adult female subjects from the California Health Interview Survey. Height 67 64 65 61 68 61 61 65 59 70 59 63 66 64 Weight 140 228 160 130 140 135 118 135 162 201 110 150 215 125 (a) Use a 0.05 significance...
Listed below are heights (in inches) and weight (in pounds) of
randomly selected adult females subjects from the California Health
Interview Survey
3) Listed below are heights (in inches) and weight (in pounds) of randomly selected adult female subjects from the California Health Interview Survey. Height 67 64 65 61 68 61 61 65 59 70 59 63 66 64 Weight 140 228 160 130 140 135 118 135 162 201 110 150 215 125 (a) Use a 0.05 significance...
 Homework _ (201901-MAT258-8 × ㅮ Continue: Homework 1-1-(201 × ㅮ Take Test Homework 1-1-(2013 × ㅮ Courses " Blackboard Learn × 1 + → C 을 https:/ oswego open sunyedu/webapps/assessment/take takejsp?course assessment, d- 71097 1&course id-3103_1&content d 1112195 1&question num 5 ☆ E or Close Window Save and Submit Click Submit to complete this assessment Question 5 of Question5 4 points Save Answer Data obtained from the National Center for Health Statistics show that men between the ages of 20...
Most questions answered within 3 hours.
-
If you’re standing at the bottom of a hill and asked to evaluate
it while being...
asked 34 minutes ago -
1. Which region has taken the lead in the world of
e-waste handling?
a) European Union...
asked 28 minutes ago -
A 8.15- g bullet from a 9-mm pistol has a velocity of 366.0 m/s.
It strikes...
asked 2 hours ago -
The outstanding bonds of Alpha Extracts have a yield to maturity
of 7.4 percent and a...
asked 1 hour ago -
The Problem: The Case of the Harmonizing Vacations
Your CEO is exploring partnering with a European...
asked 3 hours ago -
A chemical equation is balanced by adding coefficients in front
of some formulas so that the...
asked 3 hours ago -
From the literature (reference your sources): What are the
lattice parameters of calcite and aragonite? Why...
asked 4 hours ago -
Your system is rejecting the question am asking which is
preceded by a case study. It...
asked 4 hours ago -
3. On January 2, 2000, Larry creates a trust with himself as
trustee. Larry as trustee...
asked 4 hours ago -
A member of the volleyball team spikes the ball. During this
process, she changes the velocity...
asked 4 hours ago -
Are adult gamers less likely to use a gaming console (Xbox,
PlayStation, Wii, etc...) than teen...
asked 5 hours ago -
The University of
Texas recently reported that 43% of college students aged 18-24
would spend their...
asked 5 hours ago