A sample of 10 adult men gave the following data on their heights and weights. Height...
A sample of 10 adult men gave the following data on their heights and weights.
|
Height (inches) |
X |
62 |
62 |
63 |
65 |
66 |
67 |
68 |
68 |
70 |
72 |
|
Weight (pounds) |
Y |
120 |
140 |
130 |
150 |
142 |
130 |
135 |
175 |
149 |
168 |
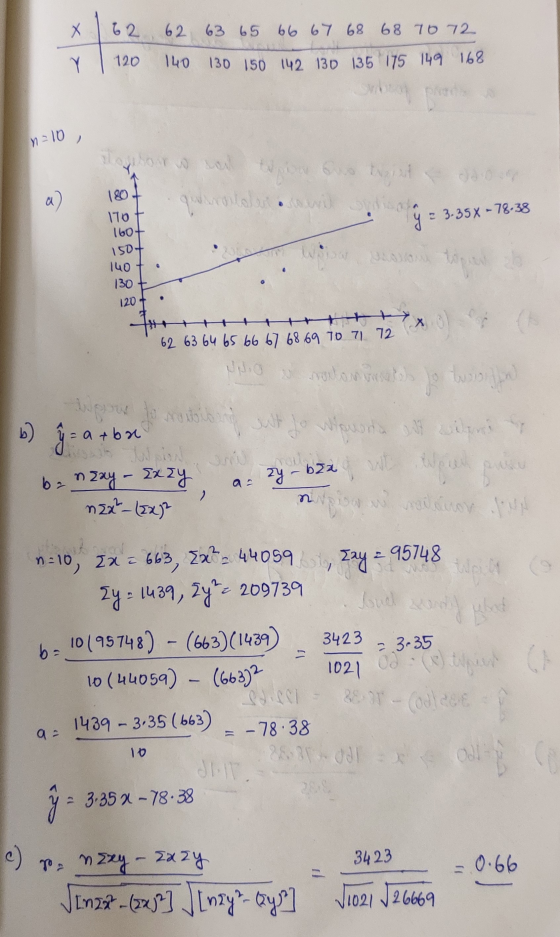
a. Generate the scatter plot of this data and graph the regression line in your plot. Include a picture of this graph and explain your impression of how well the line fits the data.
b. State the equation of the regression line.
c. Find r (correlation coefficient). Interpret the value of r in the context of this problem.
d. Find the coefficient of determination, r2. Explain what it means in the context of this problem.
e. Provide examples of other lurking variables that may have an effect on weight besides height.
f. Predict the weight of a man whose height is 60 inches.
g. Predict the height of a man whose weight is 160 pounds.
Homework Answers

Add Answer to:
A sample of 10 adult men gave the following data on their
heights and weights.
Height...
A sample of 10 adult men gave the following data on their heights and weights. Height...
A sample of 10 adult men gave the following data on their heights and weights. Height (inches) X 62 62 63 65 66 67 68 68 70 72 Weight (pounds) Y 120 140 130 150 142 130 135 175 149 168 (2 points) Generate the scatter plot of this data and graph the regression line in your plot. Include a picture of this graph and explain your impression of how well the line fits the data. The X is the...
Listed below are heights (in inches) and weight (in pounds) of randomly selected adult females subjects...
 Listed below are heights (in inches) and weight (in pounds) of
randomly selected adult females subjects from the California Health
Interview Survey
3) Listed below are heights (in inches) and weight (in pounds) of randomly selected adult female subjects from the California Health Interview Survey. Height 67 64 65 61 68 61 61 65 59 70 59 63 66 64 Weight 140 228 160 130 140 135 118 135 162 201 110 150 215 125 (a) Use a 0.05 significance...
Listed below are heights (in inches) and weight (in pounds) of
randomly selected adult females subjects from the California Health
Interview Survey
3) Listed below are heights (in inches) and weight (in pounds) of randomly selected adult female subjects from the California Health Interview Survey. Height 67 64 65 61 68 61 61 65 59 70 59 63 66 64 Weight 140 228 160 130 140 135 118 135 162 201 110 150 215 125 (a) Use a 0.05 significance...
Plz help The university medical unit is collecting data on the heights (in inches) and weights...
 Plz help
The university medical unit is collecting data on the heights (in inches) and weights (in pounds) of the female students on campus. A random sample of ten female students showed the following heights and Height (Inches) Weight (pounds) 60 110 115 110 125 135 145 140 145 150 155 62 63 64 67 68 70 10 Perform a regression analysis (as described on the handout) on this data. TAT 4.3 Problem Hw
Plz help
The university medical unit is collecting data on the heights (in inches) and weights (in pounds) of the female students on campus. A random sample of ten female students showed the following heights and Height (Inches) Weight (pounds) 60 110 115 110 125 135 145 140 145 150 155 62 63 64 67 68 70 10 Perform a regression analysis (as described on the handout) on this data. TAT 4.3 Problem Hw
Listed below are the heights In Inches and weights in pounds of 10 Super Models. Models...
 Listed below are the heights In Inches and weights in pounds of 10 Super Models. Models of this type are typically tall and thin. From the given pairs of data, your task is to do the following: 1) Construct a Seatter Diagram 2) Determine the Line of Regression (9 = bo + bx) 3) Calculate the Coefficient of Correlation (r) 4) Make a Prediction You must show your work to get full credit. Round all answers to 2 decimal places...
D Question 6 2 pts A study on heights and weights. Average height = 73 inches...
 D Question 6 2 pts A study on heights and weights. Average height = 73 inches and SD = 2 Average weight = 180 pounds and SD = 39 r=0.42 Predict the weight (y) from height (x) using the regression method (long method) for a person who is 75 inches tall.
1. The concept of fitting a line to bivariate data has been attributed to Francis Galton...
 1. The concept of fitting a line to bivariate data has been attributed to Francis Galton in an 1885 study of the heights of parents and their adult children. The table below presents the heights for a group of fathers and their adult sons. Create a scatter plot of the data. Find the least squares regression line of the son's height (y) on the father's height (x), and plot it on the scatter plot. Test the hypothesis that the slope...
The following table lists the heights in inches and weights in pounds of six football quarterbacks....
 The following table lists the heights in inches and weights in pounds of six football quarterbacks. Height Weight 72 217 71 205 76 215 75 212 71 219 76 221 The Icast-squares regression equation is D = 158.7740 + 0.7627x. If two quarterbacks differ in height by 6 inches, by how much would you predict their weights to differ? 952.64 pounds 4.58 pounds 6.00 pounds C 0.76 pounds
The following data were collected on the height (inches) and weight (pounds) of 5 students. Height...
The following data were collected on the height (inches) and weight (pounds) of 5 students. Height 72 70 62 65 67 Weight 180 172 125 132 145 a. Develop a regression model to predict weight based on height. b. What percent of the total variation in weight has been explained by height? c. If a student is 69 inches tall, what would you estimate the weight to be? Please use the Excel Solver to solve the above exercise question
Height vs Weight - Erroneous Data: You will need to use software to answer these questions....
 Height vs Weight - Erroneous Data: You will
need to use software to answer these questions.
Below is the scatterplot, regression line, and corresponding data
for the height and weight of 11 randomly selected adults. You
should notice something odd about the last entry.
index
height (x)
weight (y)
inches
pounds
1
60
120
2
72
200
3
65
130
4
72
205
5
67
180
6
69
180
7
68
193
8
69
195
9
61
115
10...
Height vs Weight - Erroneous Data: You will
need to use software to answer these questions.
Below is the scatterplot, regression line, and corresponding data
for the height and weight of 11 randomly selected adults. You
should notice something odd about the last entry.
index
height (x)
weight (y)
inches
pounds
1
60
120
2
72
200
3
65
130
4
72
205
5
67
180
6
69
180
7
68
193
8
69
195
9
61
115
10...
The following data were collected on the height (inches) and weight (pounds) of women swimmers where...
The following data were collected on the height (inches) and weight (pounds) of women swimmers where height is the independent variable and weight is the dependent variable. Height (x) = 68, 64, 62, 65, 66 Weight (y) = 132, 108, 102, 115, 128 a)Compute SSE, SST, and SSR b)Compute the coefficient of determination r2. Comment on the goodness of fit. c)Compute the sample correlation coefficient.
 Listed below are heights (in inches) and weight (in pounds) of
randomly selected adult females subjects from the California Health
Interview Survey
3) Listed below are heights (in inches) and weight (in pounds) of randomly selected adult female subjects from the California Health Interview Survey. Height 67 64 65 61 68 61 61 65 59 70 59 63 66 64 Weight 140 228 160 130 140 135 118 135 162 201 110 150 215 125 (a) Use a 0.05 significance...
Listed below are heights (in inches) and weight (in pounds) of
randomly selected adult females subjects from the California Health
Interview Survey
3) Listed below are heights (in inches) and weight (in pounds) of randomly selected adult female subjects from the California Health Interview Survey. Height 67 64 65 61 68 61 61 65 59 70 59 63 66 64 Weight 140 228 160 130 140 135 118 135 162 201 110 150 215 125 (a) Use a 0.05 significance...
 Plz help
The university medical unit is collecting data on the heights (in inches) and weights (in pounds) of the female students on campus. A random sample of ten female students showed the following heights and Height (Inches) Weight (pounds) 60 110 115 110 125 135 145 140 145 150 155 62 63 64 67 68 70 10 Perform a regression analysis (as described on the handout) on this data. TAT 4.3 Problem Hw
Plz help
The university medical unit is collecting data on the heights (in inches) and weights (in pounds) of the female students on campus. A random sample of ten female students showed the following heights and Height (Inches) Weight (pounds) 60 110 115 110 125 135 145 140 145 150 155 62 63 64 67 68 70 10 Perform a regression analysis (as described on the handout) on this data. TAT 4.3 Problem Hw
 Listed below are the heights In Inches and weights in pounds of 10 Super Models. Models of this type are typically tall and thin. From the given pairs of data, your task is to do the following: 1) Construct a Seatter Diagram 2) Determine the Line of Regression (9 = bo + bx) 3) Calculate the Coefficient of Correlation (r) 4) Make a Prediction You must show your work to get full credit. Round all answers to 2 decimal places...
 D Question 6 2 pts A study on heights and weights. Average height = 73 inches and SD = 2 Average weight = 180 pounds and SD = 39 r=0.42 Predict the weight (y) from height (x) using the regression method (long method) for a person who is 75 inches tall.
 1. The concept of fitting a line to bivariate data has been attributed to Francis Galton in an 1885 study of the heights of parents and their adult children. The table below presents the heights for a group of fathers and their adult sons. Create a scatter plot of the data. Find the least squares regression line of the son's height (y) on the father's height (x), and plot it on the scatter plot. Test the hypothesis that the slope...
 The following table lists the heights in inches and weights in pounds of six football quarterbacks. Height Weight 72 217 71 205 76 215 75 212 71 219 76 221 The Icast-squares regression equation is D = 158.7740 + 0.7627x. If two quarterbacks differ in height by 6 inches, by how much would you predict their weights to differ? 952.64 pounds 4.58 pounds 6.00 pounds C 0.76 pounds
 Height vs Weight - Erroneous Data: You will
need to use software to answer these questions.
Below is the scatterplot, regression line, and corresponding data
for the height and weight of 11 randomly selected adults. You
should notice something odd about the last entry.
index
height (x)
weight (y)
inches
pounds
1
60
120
2
72
200
3
65
130
4
72
205
5
67
180
6
69
180
7
68
193
8
69
195
9
61
115
10...
Height vs Weight - Erroneous Data: You will
need to use software to answer these questions.
Below is the scatterplot, regression line, and corresponding data
for the height and weight of 11 randomly selected adults. You
should notice something odd about the last entry.
index
height (x)
weight (y)
inches
pounds
1
60
120
2
72
200
3
65
130
4
72
205
5
67
180
6
69
180
7
68
193
8
69
195
9
61
115
10...
Most questions answered within 3 hours.
-
A distribution center for a sporting goods retailer places
orders with manufacturers for a variety of...
asked 1 minute from now -
Suppose you have a bag of Skittles with 27 blue Skittles, 18
green
Skittles, 32 red...
asked 1 minute ago -
Sketch the circuit diagram for an inverting amplifier, and give
component values that will produce a...
asked 4 minutes ago -
Develop in C language the function whose prototype is described
below. Please, send the entire code,...
asked 22 minutes ago -
What single payment today would replace a payment stream of
$50,000 that will be paid today,...
asked 15 minutes ago -
please c++ with functions *Modify the Guessing Game Write the
secret number to a file. Then...
asked 16 minutes ago -
Question about ACID/BASE. Equal volumes of 0.230 M weak base (Kb
= 4.0× 10⁻⁹) and 0.230...
asked 21 minutes ago -
The charges and coordinates of two charged particles held fixed
in an xy plane are q1...
asked 23 minutes ago -
A particle of mass M = 7.5 kg is at a position r = (-3 i...
asked 23 minutes ago -
Please answer the question below with complete explanation and a
light rays drawing of the concave...
asked 26 minutes ago -
On January 4th, Stevens Manufacturing received an
order for 30 uniforms. The following information pertained to...
asked 35 minutes ago -
what is the present value of a 3 year growing annuity with the
first payment of...
asked 42 minutes ago