A sample of 10 adult men gave the following data on their heights and weights. Height...
- A sample of 10 adult men gave the following data on their heights and weights.
|
Height (inches) |
X |
62 |
62 |
63 |
65 |
66 |
67 |
68 |
68 |
70 |
72 |
|
Weight (pounds) |
Y |
120 |
140 |
130 |
150 |
142 |
130 |
135 |
175 |
149 |
168 |
- (2 points) Generate the scatter plot of this data and graph the regression line in your plot. Include a picture of this graph and explain your impression of how well the line fits the data.
The X is the horizontal axis and shows the explanatory variable and the Y axis is the response. So in this scatter plot shows the man’s weight in response his height.
- (1 point) State the equation of the regression line. Y= a + bX
- (2 points) Find r (correlation coefficient). Interpret the value of r in the context of
this problem. r= 0.6559800965 This number shows a positive correlation between weight and height.
- (2 points) Find the coefficient of determination,
r2. Explain what it means in the context of this
problem. r2= 0.65598006965 65.60% of the
variation in weight is explained by variation in
height
- (1 point) Provide examples of other lurking variables that may have an effect on weight besides height. Other variables that may affect weight could be family history (genetics), eating habits, or activity level.
- (1 point) Predict the weight of a man whose height is 60 inches.
- (1 point) Predict the height of a man whose weight is 160 pounds.
F and G is what I am having problems with.
Homework Answers
a)

b)
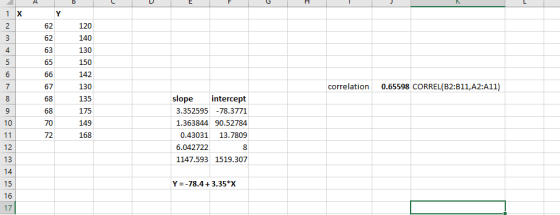
We will be applying the Linear regression model here, it can be done by using the function =LINEST(y_value, x_value, TRUE, TRUE) where y_values contain values of Weight here and x_values have Height values.
Select 5 rows and 2 columns and then write the formula in the first cell and after that, press Shift + Ctrl + Enter.
The equation comes out to be -
Y = -78.4 + 3.35*X
c)
The r value of 0.655 shows a positive strong relationship between the two variables.
d)
The coefficient of determination comes out to be 0.43, which means the change in Weight can be explained 43% by the height.
e)
Other variables that may affect weight could be family history (genetics), eating habits, or activity level.
f)
When X = 60
Y = -78.4 + 3.35*X
Y = -78.4 + 3.35*60 = 122.8
g)
When Y = 160
160 = -78.4 + 3.35*X
238.4/3.35 = X
Add Answer to:
A sample of 10 adult men gave the following data on their
heights and weights.
Height...
A sample of 10 adult men gave the following data on their heights and weights. Height...
A sample of 10 adult men gave the following data on their heights and weights. Height (inches) X 62 62 63 65 66 67 68 68 70 72 Weight (pounds) Y 120 140 130 150 142 130 135 175 149 168 a. Generate the scatter plot of this data and graph the regression line in your plot. Include a picture of this graph and explain your impression of how well the line fits the data. b. State the equation of...
Please show all work AND any calculator functions. The table below summarizes data of heights and...
Please show all work AND any calculator functions. The table below summarizes data of heights and weights of 8 randomly selected adults. Use this information to answer parts a) – h). Height (x) in inches 5.2 5.6 5.8 5.9 5.4 6.1 6.0 5.7 Weight (y) in pounds 119 136 155 185 135 202 194 165 a) Test the claim ρ ≠ 0. Use α = 0.01. • State the hypotheses and label the claim. • State the significance level (α)....
D Question 6 2 pts A study on heights and weights. Average height = 73 inches...
 D Question 6 2 pts A study on heights and weights. Average height = 73 inches and SD = 2 Average weight = 180 pounds and SD = 39 r=0.42 Predict the weight (y) from height (x) using the regression method (long method) for a person who is 75 inches tall.
Listed below are the heights In Inches and weights in pounds of 10 Super Models. Models...
 Listed below are the heights In Inches and weights in pounds of 10 Super Models. Models of this type are typically tall and thin. From the given pairs of data, your task is to do the following: 1) Construct a Seatter Diagram 2) Determine the Line of Regression (9 = bo + bx) 3) Calculate the Coefficient of Correlation (r) 4) Make a Prediction You must show your work to get full credit. Round all answers to 2 decimal places...
The following data were collected on the height (inches) and weight (pounds) of women swimmers where...
The following data were collected on the height (inches) and weight (pounds) of women swimmers where height is the independent variable and weight is the dependent variable. Height (x) = 68, 64, 62, 65, 66 Weight (y) = 132, 108, 102, 115, 128 a)Compute SSE, SST, and SSR b)Compute the coefficient of determination r2. Comment on the goodness of fit. c)Compute the sample correlation coefficient.
The following data were collected on the height (inches) and weight (pounds) of 5 students. Height...
The following data were collected on the height (inches) and weight (pounds) of 5 students. Height 72 70 62 65 67 Weight 180 172 125 132 145 a. Develop a regression model to predict weight based on height. b. What percent of the total variation in weight has been explained by height? c. If a student is 69 inches tall, what would you estimate the weight to be? Please use the Excel Solver to solve the above exercise question
Listed below are heights (in inches) and weight (in pounds) of randomly selected adult females subjects...
 Listed below are heights (in inches) and weight (in pounds) of
randomly selected adult females subjects from the California Health
Interview Survey
3) Listed below are heights (in inches) and weight (in pounds) of randomly selected adult female subjects from the California Health Interview Survey. Height 67 64 65 61 68 61 61 65 59 70 59 63 66 64 Weight 140 228 160 130 140 135 118 135 162 201 110 150 215 125 (a) Use a 0.05 significance...
Listed below are heights (in inches) and weight (in pounds) of
randomly selected adult females subjects from the California Health
Interview Survey
3) Listed below are heights (in inches) and weight (in pounds) of randomly selected adult female subjects from the California Health Interview Survey. Height 67 64 65 61 68 61 61 65 59 70 59 63 66 64 Weight 140 228 160 130 140 135 118 135 162 201 110 150 215 125 (a) Use a 0.05 significance...
Plz help The university medical unit is collecting data on the heights (in inches) and weights...
 Plz help
The university medical unit is collecting data on the heights (in inches) and weights (in pounds) of the female students on campus. A random sample of ten female students showed the following heights and Height (Inches) Weight (pounds) 60 110 115 110 125 135 145 140 145 150 155 62 63 64 67 68 70 10 Perform a regression analysis (as described on the handout) on this data. TAT 4.3 Problem Hw
Plz help
The university medical unit is collecting data on the heights (in inches) and weights (in pounds) of the female students on campus. A random sample of ten female students showed the following heights and Height (Inches) Weight (pounds) 60 110 115 110 125 135 145 140 145 150 155 62 63 64 67 68 70 10 Perform a regression analysis (as described on the handout) on this data. TAT 4.3 Problem Hw
Height vs Weight - Erroneous Data: You will need to use software to answer these questions....
 Height vs Weight - Erroneous Data: You will
need to use software to answer these questions.
Below is the scatterplot, regression line, and corresponding data
for the height and weight of 11 randomly selected adults. You
should notice something odd about the last entry.
index
height (x)
weight (y)
inches
pounds
1
60
120
2
72
200
3
65
130
4
72
205
5
67
180
6
69
180
7
68
193
8
69
195
9
61
115
10...
Height vs Weight - Erroneous Data: You will
need to use software to answer these questions.
Below is the scatterplot, regression line, and corresponding data
for the height and weight of 11 randomly selected adults. You
should notice something odd about the last entry.
index
height (x)
weight (y)
inches
pounds
1
60
120
2
72
200
3
65
130
4
72
205
5
67
180
6
69
180
7
68
193
8
69
195
9
61
115
10...
13. You are given the following regression equation for a scatter plot which The displays data...
13. You are given the following regression equation for a scatter plot which The displays data for x = Weight of Car (in pounds) and y = Miles per Gallon in City: y = −0.006x + 42.825 r2 = 0.7496 (Note: The scatter plot graph is attached to the Canvas assignment as a separate document.) (a) Find the value of r based on the information given. (b) Based on your value of r, what conclusion can you make about the...
 D Question 6 2 pts A study on heights and weights. Average height = 73 inches and SD = 2 Average weight = 180 pounds and SD = 39 r=0.42 Predict the weight (y) from height (x) using the regression method (long method) for a person who is 75 inches tall.
 Listed below are the heights In Inches and weights in pounds of 10 Super Models. Models of this type are typically tall and thin. From the given pairs of data, your task is to do the following: 1) Construct a Seatter Diagram 2) Determine the Line of Regression (9 = bo + bx) 3) Calculate the Coefficient of Correlation (r) 4) Make a Prediction You must show your work to get full credit. Round all answers to 2 decimal places...
 Listed below are heights (in inches) and weight (in pounds) of
randomly selected adult females subjects from the California Health
Interview Survey
3) Listed below are heights (in inches) and weight (in pounds) of randomly selected adult female subjects from the California Health Interview Survey. Height 67 64 65 61 68 61 61 65 59 70 59 63 66 64 Weight 140 228 160 130 140 135 118 135 162 201 110 150 215 125 (a) Use a 0.05 significance...
Listed below are heights (in inches) and weight (in pounds) of
randomly selected adult females subjects from the California Health
Interview Survey
3) Listed below are heights (in inches) and weight (in pounds) of randomly selected adult female subjects from the California Health Interview Survey. Height 67 64 65 61 68 61 61 65 59 70 59 63 66 64 Weight 140 228 160 130 140 135 118 135 162 201 110 150 215 125 (a) Use a 0.05 significance...
 Plz help
The university medical unit is collecting data on the heights (in inches) and weights (in pounds) of the female students on campus. A random sample of ten female students showed the following heights and Height (Inches) Weight (pounds) 60 110 115 110 125 135 145 140 145 150 155 62 63 64 67 68 70 10 Perform a regression analysis (as described on the handout) on this data. TAT 4.3 Problem Hw
Plz help
The university medical unit is collecting data on the heights (in inches) and weights (in pounds) of the female students on campus. A random sample of ten female students showed the following heights and Height (Inches) Weight (pounds) 60 110 115 110 125 135 145 140 145 150 155 62 63 64 67 68 70 10 Perform a regression analysis (as described on the handout) on this data. TAT 4.3 Problem Hw
 Height vs Weight - Erroneous Data: You will
need to use software to answer these questions.
Below is the scatterplot, regression line, and corresponding data
for the height and weight of 11 randomly selected adults. You
should notice something odd about the last entry.
index
height (x)
weight (y)
inches
pounds
1
60
120
2
72
200
3
65
130
4
72
205
5
67
180
6
69
180
7
68
193
8
69
195
9
61
115
10...
Height vs Weight - Erroneous Data: You will
need to use software to answer these questions.
Below is the scatterplot, regression line, and corresponding data
for the height and weight of 11 randomly selected adults. You
should notice something odd about the last entry.
index
height (x)
weight (y)
inches
pounds
1
60
120
2
72
200
3
65
130
4
72
205
5
67
180
6
69
180
7
68
193
8
69
195
9
61
115
10...
Most questions answered within 3 hours.
-
5)
Typically,
there will need to be a rather high degree of coordination and
interaction among...
asked 44 seconds from now -
if the marginal revenue on each MRI is $2500, and the
marginal cost for each is...
asked 1 minute ago -
For a reaction, reagents --->products, it's forwarding rate
(rate of products formation) is proportional to the...
asked 3 minutes ago -
The amounts of nicotine in a certain brand of cigarette are
normally distributed with a mean...
asked 5 minutes ago -
What did Butler and Hobbes contribute to our understanding of
utilitarianism?
asked 6 minutes ago -
History
Lincoln's religious thought was almost exclusively shaped by his
Calvinist upbringing.
True
False
QUESTION 6...
asked 5 minutes ago -
In a two-way factorial ANOVA, the final F-ratio for
factor AxB is determined by dividing _____...
asked 6 minutes ago -
If 1.6g of CH4 reacts with oxygen gas to form water and carbon
dioxide what is...
asked 5 minutes ago -
Applying the content from Primal Leadership, and the format
Personal Change Plan on p. 110 Boyatzis...
asked 7 minutes ago -
Your black labrador has a genotype of BbEe.
Which of the following is correct? Select all...
asked 11 minutes ago -
Which of the following statements explains why the cost of
advertising might be relevant to a...
asked 21 minutes ago -
NO3- nitrate ion, what is the symmetry operationof rotation of
it?
asked 26 minutes ago