
Homework Answers
Since the lowest value in the data set is 0.4 and the highest id 10.1, we can make 6 class intervals, each of width 2. Thus, starting from 0-2, 2-4, 4-6 and so on.
We now organise our data in the frequency distribution according to our class intervals:
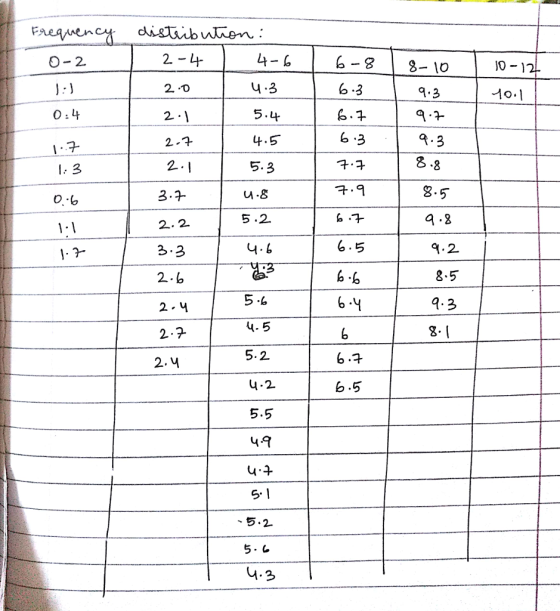
Thereafter, we count the number of observations in each class and construct our frequency table:

Now, we will construct our histogram,

Thus, from the shape of the histogram it can be seen that it is a symmetric distribution .
Add Answer to:
421(26Pts)Page 47. Problem 42: a, b. 42. A recent study of home technologies reported the number...
(a) A recent study of home technologies reported (as per the following table) the number of...
(a) A recent study of home technologies reported (as per the following table) the number of hours of personal computer usage per week for a sample of 60 persons. 9.3 5.3 6.3 8.8 6.5 0.6 5.2 6.6 9.3 4.3 6.3 2.1 2.7 0.4 3.7 3.3 1.1 2.7 6.7 6.5 4.3 9.7 7.7 5.2 1.7 8.5 4.2 5.5 5.1 5.6 5.4 4.8 2.1 10.1 1.3 5.6 2.4 2.4 4.7 1.7 2.0 6.7 1.1 6.7 2.2 2.6 9.8 6.4 4.9 5.2 4.5...
The data on the below shows the number of hours a particular drug is in the...
The data on the below shows the number of hours a particular drug is in the system of 200 females. Develop a histogram of this data according to the following intervals: Follow the directions. Test the hypothesis that these data are distributed exponentially. Determine the test statistic. Round to two decimal places. (sort the data first) [0, 3) [3, 6) [6, 9) [9, 12) [12, 18) [18, 24) [24, infinity) 34.7 11.8 10 7.8 2.8 20 9.8 20.4 1.2 7.2...
This data was collected at a physician’s office. One measure of patient satisfaction is the likel...
This data was collected at a physician’s office. One measure of patient satisfaction is the likelihood of a patient scheduling a return appointment. The goal is to keep the proportion of patients “unlikely” to schedule a return appointment to at most 25%. Test if the goal is being met. Use =.05. Clearly state your conclusion. DATA: Return Appointment Employment Status Age Distance Unlikely Employed 62 12.7 Unlikely Unemployed 46 10.6 Likely Employed 59 9.7 Unlikely Unemployed 42 5.4 Likely Employed ...
2. A recent study by the University of Pittsburg showed that the average number of airplanes...
 2. A recent study by the University of Pittsburg showed that the average number of airplanes flying over downtown Pittsburg is four per hour. Assume the passing of these airplanes is approximated by the Poisson distribution. (a) Find the probability that no airplanes flew over Pittsburg between 8am and 9am on Sunday. (b) Find the probability that exactly three airplanes flew during that time. (c) Find the probability that exactly four airplanes flew during that time (d) Find the probability...
2. A recent study by the University of Pittsburg showed that the average number of airplanes...
 2. A recent study by the University of Pittsburg showed that the average number of airplanes flying over downtown Pittsburg is four per hour. Assume the passing of these airplanes is approximated by the Poisson distribution (a) Find the probability that no airplanes flew over Pittsburg between 8am and 9am on Sunday. (b) Find the probability that exactly three airplanes flew during that time. (c) Find the probability that exactly four airplanes flew during that time. (d) Find the probability...
INN MARGIN ROOMS NEAREST OFFICE COLLEGE INCOME DISTTWN 1 44.2 3471 2.1 523 12 35 9.4...
 INN
MARGIN
ROOMS
NEAREST
OFFICE
COLLEGE
INCOME
DISTTWN
1
44.2
3471
2.1
523
12
35
9.4
2
29.8
3567
1.8
140
13.5
42
5.7
3
38.4
3264
1.6
404
22.5
45
4.4
4
54.4
3234
1.1
649
19.5
35
6.5
5
34.5
2730
4
171
17
41
10.5
6
44.9
3003
3.4
402
15.5
37
4.6
7
46
2341
2
580
23
45
7.4
8
50.2
3021
2.6
572
8.5
33
9.3
9
46
2655
3.2
666
22
40
6.7...
INN
MARGIN
ROOMS
NEAREST
OFFICE
COLLEGE
INCOME
DISTTWN
1
44.2
3471
2.1
523
12
35
9.4
2
29.8
3567
1.8
140
13.5
42
5.7
3
38.4
3264
1.6
404
22.5
45
4.4
4
54.4
3234
1.1
649
19.5
35
6.5
5
34.5
2730
4
171
17
41
10.5
6
44.9
3003
3.4
402
15.5
37
4.6
7
46
2341
2
580
23
45
7.4
8
50.2
3021
2.6
572
8.5
33
9.3
9
46
2655
3.2
666
22
40
6.7...
4.3 Analysis Assignment #4 Note 1: all assignments moving forward must adhere to the appropriate Six Ste...
 4.3 Analysis Assignment #4 Note 1: all assignments moving forward must adhere to the appropriate Six Step Process (SSP). As our study materials have specified, the SSP has 3 versions. Version 1 is to be used for all t-tests; for all correlation analyses and Version 3 is be used for all regression analyses. Note 2: The data sets for Q1, Q2 and Q3 below can be downloaded here. Week 4 Analysis Assignments.xlsx Q1: (30 points) Complete the following data analysis:...
26. (For this question use the data file Per Capita Link). A researcher interested in examining...
 26. (For this question use the data file Per Capita Link). A researcher interested in examining how a state's per capita income may be affected by the percent of the state's adult population that has not completed high school and the percent of the state's population that is foreign bom. part a: Write down an appropriate model for this researcher to estimate. Clearly identify what is the response variable and what are the explanatory variables. part b: Using regression analysis,...
INN MARGIN ROOMS NEAREST OFFICE COLLEGE INCOME DISTTWN 1 61 3203 0.1 549 8 37 12.1 2 34 2810 1.5 496 17.5 39 0.4...
 INN
MARGIN
ROOMS
NEAREST
OFFICE
COLLEGE
INCOME
DISTTWN
1
61
3203
0.1
549
8
37
12.1
2
34
2810
1.5
496
17.5
39
0.4
3
46
2890
1.9
254
20
39
12.2
4
31.9
3422
1
434
15.5
36
2.7
5
57.4
2687
3.4
678
15.5
32
7.9
6
47.5
3080
2.4
488
13.5
31
6.7
7
54.4
2756
1.1
832
14.5
35
6.9
8
46.2
2244
0.7
496
15.5
38
8.9
9
54.1
2862
1.4
809
16.5
33
3...
INN
MARGIN
ROOMS
NEAREST
OFFICE
COLLEGE
INCOME
DISTTWN
1
61
3203
0.1
549
8
37
12.1
2
34
2810
1.5
496
17.5
39
0.4
3
46
2890
1.9
254
20
39
12.2
4
31.9
3422
1
434
15.5
36
2.7
5
57.4
2687
3.4
678
15.5
32
7.9
6
47.5
3080
2.4
488
13.5
31
6.7
7
54.4
2756
1.1
832
14.5
35
6.9
8
46.2
2244
0.7
496
15.5
38
8.9
9
54.1
2862
1.4
809
16.5
33
3...
We are interested in the relationship between the compensation of Chief Executive Officers (CEO) ...
We are interested in the relationship between the compensation of Chief Executive Officers (CEO) of firms and the return on equity of their respective firm, using the dataset below. The variable salary shows the annual salary of a CEO in thousands of dollars, so that y = 150 indicates a salary of $150,000. Similarly, the variable ROE represents the average return on equity (ROE)for the CEO’s firm for the previous three years. A ROE of 20 indicates an average return...
 2. A recent study by the University of Pittsburg showed that the average number of airplanes flying over downtown Pittsburg is four per hour. Assume the passing of these airplanes is approximated by the Poisson distribution. (a) Find the probability that no airplanes flew over Pittsburg between 8am and 9am on Sunday. (b) Find the probability that exactly three airplanes flew during that time. (c) Find the probability that exactly four airplanes flew during that time (d) Find the probability...
 2. A recent study by the University of Pittsburg showed that the average number of airplanes flying over downtown Pittsburg is four per hour. Assume the passing of these airplanes is approximated by the Poisson distribution (a) Find the probability that no airplanes flew over Pittsburg between 8am and 9am on Sunday. (b) Find the probability that exactly three airplanes flew during that time. (c) Find the probability that exactly four airplanes flew during that time. (d) Find the probability...
 INN
MARGIN
ROOMS
NEAREST
OFFICE
COLLEGE
INCOME
DISTTWN
1
44.2
3471
2.1
523
12
35
9.4
2
29.8
3567
1.8
140
13.5
42
5.7
3
38.4
3264
1.6
404
22.5
45
4.4
4
54.4
3234
1.1
649
19.5
35
6.5
5
34.5
2730
4
171
17
41
10.5
6
44.9
3003
3.4
402
15.5
37
4.6
7
46
2341
2
580
23
45
7.4
8
50.2
3021
2.6
572
8.5
33
9.3
9
46
2655
3.2
666
22
40
6.7...
INN
MARGIN
ROOMS
NEAREST
OFFICE
COLLEGE
INCOME
DISTTWN
1
44.2
3471
2.1
523
12
35
9.4
2
29.8
3567
1.8
140
13.5
42
5.7
3
38.4
3264
1.6
404
22.5
45
4.4
4
54.4
3234
1.1
649
19.5
35
6.5
5
34.5
2730
4
171
17
41
10.5
6
44.9
3003
3.4
402
15.5
37
4.6
7
46
2341
2
580
23
45
7.4
8
50.2
3021
2.6
572
8.5
33
9.3
9
46
2655
3.2
666
22
40
6.7...
 4.3 Analysis Assignment #4 Note 1: all assignments moving forward must adhere to the appropriate Six Step Process (SSP). As our study materials have specified, the SSP has 3 versions. Version 1 is to be used for all t-tests; for all correlation analyses and Version 3 is be used for all regression analyses. Note 2: The data sets for Q1, Q2 and Q3 below can be downloaded here. Week 4 Analysis Assignments.xlsx Q1: (30 points) Complete the following data analysis:...
 26. (For this question use the data file Per Capita Link). A researcher interested in examining how a state's per capita income may be affected by the percent of the state's adult population that has not completed high school and the percent of the state's population that is foreign bom. part a: Write down an appropriate model for this researcher to estimate. Clearly identify what is the response variable and what are the explanatory variables. part b: Using regression analysis,...
 INN
MARGIN
ROOMS
NEAREST
OFFICE
COLLEGE
INCOME
DISTTWN
1
61
3203
0.1
549
8
37
12.1
2
34
2810
1.5
496
17.5
39
0.4
3
46
2890
1.9
254
20
39
12.2
4
31.9
3422
1
434
15.5
36
2.7
5
57.4
2687
3.4
678
15.5
32
7.9
6
47.5
3080
2.4
488
13.5
31
6.7
7
54.4
2756
1.1
832
14.5
35
6.9
8
46.2
2244
0.7
496
15.5
38
8.9
9
54.1
2862
1.4
809
16.5
33
3...
INN
MARGIN
ROOMS
NEAREST
OFFICE
COLLEGE
INCOME
DISTTWN
1
61
3203
0.1
549
8
37
12.1
2
34
2810
1.5
496
17.5
39
0.4
3
46
2890
1.9
254
20
39
12.2
4
31.9
3422
1
434
15.5
36
2.7
5
57.4
2687
3.4
678
15.5
32
7.9
6
47.5
3080
2.4
488
13.5
31
6.7
7
54.4
2756
1.1
832
14.5
35
6.9
8
46.2
2244
0.7
496
15.5
38
8.9
9
54.1
2862
1.4
809
16.5
33
3...
Most questions answered within 3 hours.
-
Company Risk Premium A company has a beta of
4.57. If the market return is expected...
asked 1 minute ago -
Arthur Meiners is the production manager of Wheel-Rite, a small
producer of metal parts. Wheel-Rite supplies...
asked 3 minutes ago -
3. Which statement about nuclear fission is correct? (1
point)
A. Nuclear fission provides energy for...
asked 7 minutes ago -
If a $2,000 increase in income leads to a $1,5000 increase in
consumption expenditures, then the...
asked 7 minutes ago -
May you please put this in layman's terms?
ABSTRACT
Coagulase-negative staphylococci (CoNS) and Staphylococcus
aureus are...
asked 11 minutes ago -
If authentic leadership is really a lifelong process,
can teenagers be authentic leaders? Why or why...
asked 27 minutes ago -
Six years of quarterly data of a seasonally adjusted series are
used to estimate a linear...
asked 46 minutes ago -
Which of the following is not an ecological model used
to foster behavior change?
PRECEDE-PROCEED Model...
asked 49 minutes ago -
On the Apollo 14 mission to the moon, astronaut Alan Shepard hit
a golf ball with...
asked 45 minutes ago -
What are John’s potential claims if he is terminated
this week?
John is a 54-year-old man...
asked 59 minutes ago -
A (8.5) cm tall object is placed at a distance of (14.2) cm from
a convex...
asked 1 hour ago -
(2) For the following questions, consider a data set that
exhibits a normal distribution. Report the...
asked 1 hour ago