If a solution absorbed violet light, what color would the solution appear to be? Hint: Table...
- If a solution absorbed violet light, what color would the
solution appear to be? Hint: Table I, at the beginning of the
experiment, will help you answer this one.
- Calculate the concentration of a solution prepared by adding 15.00 mL of 1.96×10−31.96×10-3 M KMnO4KMnO4 from a buret into a 50.00 mL volumetric flask, which is then filled to the 50.00 mL graduation mark with distilled water. Hint: This is a dilution calculation.
M
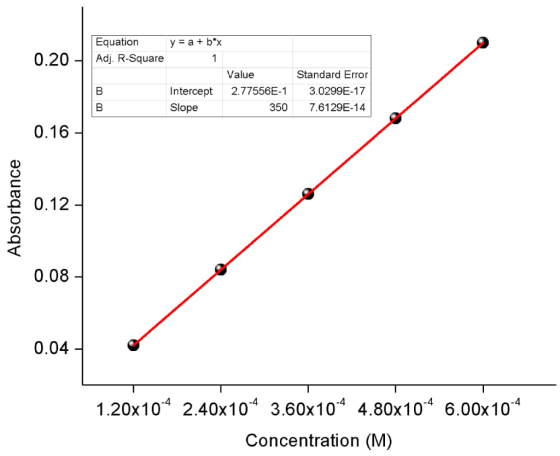
- A linear standard curve of KMnO4KMnO4 is prepared from a set of standard solutions by plotting absorbance (y) vs. concentration (x). Use Google Sheets/Excel to plot this standard curve using the data in Table 1. Help with spreadsheets [PDF]
Table 1: Data for the standard curve of KMnO4
| Absorbance | Concentration (M) |
| 0.210 | 6.00 x 10⁻⁴ |
| 0.168 | 4.80 x 10⁻⁴ |
| 0.126 | 3.60 x 10⁻⁴ |
| 0.0840 | 2.40 x 10⁻⁴ |
| 0.0420 | 1.2 x 10⁻⁴ |
After plotting the standard curve, enter its slope below (not the equation of the line). Report your answer to 3 significant figures. If your answer ends in one or more zeros, use scientific notation.
Slope = M-1
- Suppose that an unknown sample is analyzed spectrophotometrically at the same wavelength that was used for the standard curve and the absorbance was found to be 0.196. Use the standard curve to find the concentration of the unknown. Hint: Use y = mx + b to solve for the concentration (x) from the absorbance (y) and the m and b values obtained in question 2.
M
Homework Answers


Add Answer to:
If a solution absorbed violet light, what color would the
solution appear to be? Hint: Table...
I. If a solution absorbed violet light, what color would the solution appear to be? Hint:...
 I. If a solution absorbed violet light, what color would the solution appear to be? Hint: 1. Calculate the concentration of a solution prepared by adding 15.00 mL of 1.92 x 10⁻³ M KMnO, from a buret into a 50.00 mL volumetric flask, which is then filled to the 50.00 mL graduation mark with distilled water. Hint: 2. A linear standard curve of KMnO4 is prepared from a set of standard solutions by plotting absorbance (y) vs. concentration (x). Use...
1. If a solution absorbed yellow light, what color would the solution appear to be? Hint:...
 1. If a solution absorbed yellow light, what color would the solution appear to be? Hint: indigo 1. Calculate the concentration of a solution prepared by adding 15.00 mL of 2.05 x 10-'MKMnO, from a buret into a 50.00 mL volumetric flask, which is then filled to the 50.00 ml graduation mark with distilled water. Hint: 2. A linear standard curve of KMnO, is prepared from a set of standard solutions by plotting absorbance (y) vs. concentration (x). Use Google...
I. If a solution absorbed yellow light, what color would the solution appear to be? Hint:...
 I. If a solution absorbed yellow light, what color would the solution appear to be? Hint: 1. Calculate the concentration of a solution prepared by adding 15.00 mL of 2.09 x 10⁻³ M KMnO, from a buret into a 50.00 mL volumetric flask, which is then filled to the 50.00 mL graduation mark with distilled water. Hint: *M Your answer is incorrect - Check your calculations. 2. A linear standard curve of KMnO4 is prepared from a set of standard...
I. If a solution absorbed yellow light, what color would the solution appear to be? Hint:...
 I. If a solution absorbed yellow light, what color would the solution appear to be? Hint: Indigo 1. Calculate the concentration of a solution prepared by adding 15.00 mL of 2.09 x 10⁻³ MKMnO4 from a buret into a 50.00 mL volumetric flask, which is then filled to the 50.00 mL graduation mark with distilled water. Hint: 0.000627 M 2. A linear standard curve of KMnO4 is prepared from a set of standard solutions by plotting absorbance (y) vs. concentration...
I. If a solution absorbed orange light, what color would the solution appear to be? Hint:...
 I. If a solution absorbed orange light, what color would the solution appear to be? Hint: 1. Calculate the concentration of a solution prepared by adding 15.00 mL of 1.96 x 10-'MKMnO from a buret into a 50.00 mL volumetric flask, which is then filled to the 50.00 mL graduation mark with distilled water. Hint: M 2. A linear standard curve of KMnO4 is prepared from a set of standard solutions by plotting absorbance (y) vs. concentration (x). Use Logger...
1. If a solution absorbed blue-green light, what color would the solution appear to be? Hint:...
 1. If a solution absorbed blue-green light, what color would the solution appear to be? Hint: Table I, at the beginning of the experiment, will help you answer this one. 1. Calculate the concentration of a solution prepared by adding 15.00 mL of 2.09 ~ 10-3M KMnO4 from a buret into a 50.00 mL volumetric flask, which is then filled to the 50.00 ml graduation mark with distilled water. Hint: M 2. A linear standard curve of KMnO4 is prepared...
3. Suppose that an unknown sample is analyzed spectrophotometrically at the same wavelength that was used...
 3. Suppose that an unknown sample is analyzed
spectrophotometrically at the same wavelength that was used for the
standard curve and the absorbance was found to be 0.196. Use the
standard curve to find the concentration of the unknown.
1. Calculate the concentration of a solution prepared by adding 15.00 mL of 1.98 x 10⁻³ M KMnO, from a buret into a 50.00 mL volumetric flask, which is then filled to the 50.00 mL graduation mark with distilled water. Hint:...
3. Suppose that an unknown sample is analyzed
spectrophotometrically at the same wavelength that was used for the
standard curve and the absorbance was found to be 0.196. Use the
standard curve to find the concentration of the unknown.
1. Calculate the concentration of a solution prepared by adding 15.00 mL of 1.98 x 10⁻³ M KMnO, from a buret into a 50.00 mL volumetric flask, which is then filled to the 50.00 mL graduation mark with distilled water. Hint:...
1. Calculate the concentration of a solution prepared by adding 15.00 mL of 1.97 x 10-MKMnO4...
 1. Calculate the concentration of a solution prepared by adding 15.00 mL of 1.97 x 10-MKMnO4 from a buret into a 50.00 mL volumetric flask, which is then filled to the 50.00 mL graduation mark with distilled water. Hint. This is a dilution calculation M Your answer is incorrect - Check your calculations. 2. A linear standard curve of KMnO4 is prepared from a set of standard solutions by plotting absorbance (y) vs. concentration (x). Use Google Sheets/Excel to plot...
2. A linear standard curve of KMnO is prepared from a set of standard solutions by...
 2. A linear standard curve of KMnO is prepared from a set of standard solutions by plotting absorbance (y) vs. concentration (x). Use Logger Pro (as described in the Data Analysis for this experiment), or Google Sheets/Excel, to plot this standard curve using the data in Table 1. Help with spreadsheets [PDF] Table 1: Data for the standard curve of KMnO4 Absorbance Concentration (M) 0.330 6.00 x 10⁻⁴ 0.264 4.80 x 10⁻⁴ 0.198 3.60 x 10⁻⁴ 0.132 2.40 x 10⁻⁴...
III. Standard Curves When we want to determine the concentration of an unknown solution, we typically measure a certain...
 III. Standard Curves When we want to determine the concentration of an unknown solution, we typically measure a certain property of standard solutions with our standard (known) solutions and create what's called a standard curve (or calibration curve). A standard curve relates two variables of certain known solutions. That way, when there is an unknown variable for a certain solution, it can be determined through the standard curve. When plotting standard curves, we always plot the independent variable on the...
 I. If a solution absorbed violet light, what color would the solution appear to be? Hint: 1. Calculate the concentration of a solution prepared by adding 15.00 mL of 1.92 x 10⁻³ M KMnO, from a buret into a 50.00 mL volumetric flask, which is then filled to the 50.00 mL graduation mark with distilled water. Hint: 2. A linear standard curve of KMnO4 is prepared from a set of standard solutions by plotting absorbance (y) vs. concentration (x). Use...
 1. If a solution absorbed yellow light, what color would the solution appear to be? Hint: indigo 1. Calculate the concentration of a solution prepared by adding 15.00 mL of 2.05 x 10-'MKMnO, from a buret into a 50.00 mL volumetric flask, which is then filled to the 50.00 ml graduation mark with distilled water. Hint: 2. A linear standard curve of KMnO, is prepared from a set of standard solutions by plotting absorbance (y) vs. concentration (x). Use Google...
 I. If a solution absorbed yellow light, what color would the solution appear to be? Hint: 1. Calculate the concentration of a solution prepared by adding 15.00 mL of 2.09 x 10⁻³ M KMnO, from a buret into a 50.00 mL volumetric flask, which is then filled to the 50.00 mL graduation mark with distilled water. Hint: *M Your answer is incorrect - Check your calculations. 2. A linear standard curve of KMnO4 is prepared from a set of standard...
 I. If a solution absorbed yellow light, what color would the solution appear to be? Hint: Indigo 1. Calculate the concentration of a solution prepared by adding 15.00 mL of 2.09 x 10⁻³ MKMnO4 from a buret into a 50.00 mL volumetric flask, which is then filled to the 50.00 mL graduation mark with distilled water. Hint: 0.000627 M 2. A linear standard curve of KMnO4 is prepared from a set of standard solutions by plotting absorbance (y) vs. concentration...
 I. If a solution absorbed orange light, what color would the solution appear to be? Hint: 1. Calculate the concentration of a solution prepared by adding 15.00 mL of 1.96 x 10-'MKMnO from a buret into a 50.00 mL volumetric flask, which is then filled to the 50.00 mL graduation mark with distilled water. Hint: M 2. A linear standard curve of KMnO4 is prepared from a set of standard solutions by plotting absorbance (y) vs. concentration (x). Use Logger...
 1. If a solution absorbed blue-green light, what color would the solution appear to be? Hint: Table I, at the beginning of the experiment, will help you answer this one. 1. Calculate the concentration of a solution prepared by adding 15.00 mL of 2.09 ~ 10-3M KMnO4 from a buret into a 50.00 mL volumetric flask, which is then filled to the 50.00 ml graduation mark with distilled water. Hint: M 2. A linear standard curve of KMnO4 is prepared...
 3. Suppose that an unknown sample is analyzed
spectrophotometrically at the same wavelength that was used for the
standard curve and the absorbance was found to be 0.196. Use the
standard curve to find the concentration of the unknown.
1. Calculate the concentration of a solution prepared by adding 15.00 mL of 1.98 x 10⁻³ M KMnO, from a buret into a 50.00 mL volumetric flask, which is then filled to the 50.00 mL graduation mark with distilled water. Hint:...
3. Suppose that an unknown sample is analyzed
spectrophotometrically at the same wavelength that was used for the
standard curve and the absorbance was found to be 0.196. Use the
standard curve to find the concentration of the unknown.
1. Calculate the concentration of a solution prepared by adding 15.00 mL of 1.98 x 10⁻³ M KMnO, from a buret into a 50.00 mL volumetric flask, which is then filled to the 50.00 mL graduation mark with distilled water. Hint:...
 1. Calculate the concentration of a solution prepared by adding 15.00 mL of 1.97 x 10-MKMnO4 from a buret into a 50.00 mL volumetric flask, which is then filled to the 50.00 mL graduation mark with distilled water. Hint. This is a dilution calculation M Your answer is incorrect - Check your calculations. 2. A linear standard curve of KMnO4 is prepared from a set of standard solutions by plotting absorbance (y) vs. concentration (x). Use Google Sheets/Excel to plot...
 2. A linear standard curve of KMnO is prepared from a set of standard solutions by plotting absorbance (y) vs. concentration (x). Use Logger Pro (as described in the Data Analysis for this experiment), or Google Sheets/Excel, to plot this standard curve using the data in Table 1. Help with spreadsheets [PDF] Table 1: Data for the standard curve of KMnO4 Absorbance Concentration (M) 0.330 6.00 x 10⁻⁴ 0.264 4.80 x 10⁻⁴ 0.198 3.60 x 10⁻⁴ 0.132 2.40 x 10⁻⁴...
 III. Standard Curves When we want to determine the concentration of an unknown solution, we typically measure a certain property of standard solutions with our standard (known) solutions and create what's called a standard curve (or calibration curve). A standard curve relates two variables of certain known solutions. That way, when there is an unknown variable for a certain solution, it can be determined through the standard curve. When plotting standard curves, we always plot the independent variable on the...
Most questions answered within 3 hours.
-
Engineers must consider the breadths of male heads when
designing helmets. The company researchers have determined...
asked 7 minutes ago -
In the Williamson Ether Synthesis of Phenacetin from
Acetaminophen, sodium methoxide in methanol and 100% ethanol...
asked 12 minutes ago -
If the spin of the earth suddenly changed to spin in the
opposite direction, what effect...
asked 26 minutes ago -
An orb weaver spider with a mass of 0.23 grams hangs vertically
by one of its...
asked 22 minutes ago -
Determine the sample size required to estimate the mean score on
a standardized test within
2...
asked 44 minutes ago -
The idea that one can remain relatively 'anonymous' on the
internet if they so choose, for...
asked 31 minutes ago -
In the reaction of N2 and H2 to produce
NH3, how many moles of H2 will...
asked 32 minutes ago -
When a certain coin is flipped, the probability of
obtaining a tails is 0.55. Which of...
asked 30 minutes ago -
Can you show how a sulfonic acid group
is introduced into an aromatic ring by Friedal...
asked 35 minutes ago -
Implement the Smith-Waterman algorithm in C that accepts a
substitution matrix.
You may assume the substitution...
asked 35 minutes ago -
The equilibrium constant Kp for the reaction
C(s)+H2O(g)⇌CO(g)+H2(g) is 2.44 at 1000 K. What are the...
asked 47 minutes ago -
HACKING
1: Discuss the tricks of hacking in 300 words.
2: Explain in you own words...
asked 48 minutes ago