
Homework Answers
ANSWER 1
Given :
HOME –
Demand : P = 100 – ½
Q
Supply : P = ½ Q
or
Q = 200 – 2
P
Q = 2 P
FOREIGN –
Demand : P = 200 – 2
Q
Supply : P = ¼ Q
or
Q = 100 – ½
P
Q
= 4 P
1. a. Autarchy price refers to the market clearing price in a
closed economy, that is, the price at which domestic demand equals
domestic supply, for each country.
HOME –
Demand = Supply
⇒ 200 – 2 P = 2 P
⇒ 200 = 4 P
⇒ $50 = P
FOREIGN –
Demand = Supply
⇒ 100 – ½ P = 4 P
⇒ 100 = 4 P + ½ P
⇒ 100 = 9/2 P
⇒ 200/9 = P
⇒ $22.22 = P
Given that there is no transportation cost and no trade
restriction,
if PH = Prices in Home Country & PF =
Prices in Foreign Country
Then, when PH >
PF ⇒ Home country imports until PH =
PF.
when
PH < PF ⇒ Home country exports until
PH = PF.
Here, PH = $50 & PF = $22.22,
⇒ PH > PF ⇒ Home country imports and Foreign country exports until PH = PF.
1. b. If the importer (Home) imposes a tax of t = $2/unit, the
cost for the exporter (Foreign) increases. Now, exporter will not
be willing to sell overseas unless the price difference between the
two markets is at least $2/unit.
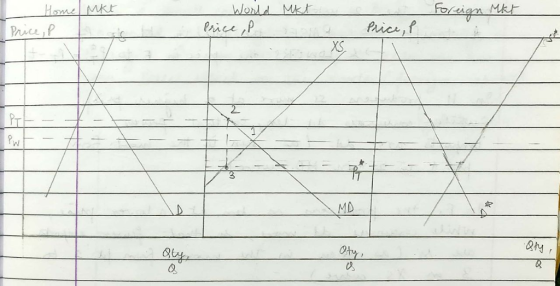
The above figure depicts this effect. In the figure, MD denotes
the Home Demand Import Curve, which is the excess of how much Home
consumers demand over what Home producers supply, that is, Home
Demand - Home Supply. On the other hand, XS denotes the Foreign
Export Supply Curve, which is the excess of how much Foreign
producers supply over what Foreign consumers demand, that is,
Foreign Supply - Foreign Demand.
In the absence of tax, price would be equalised to PW
(henceforth referred to as Price in the world market) in both Home
and Foreign, as shown by point 1 in the middle panel.
With the import tax being imposed in, the exporters will not trade
unless PH exceeds PF by at least t. If no
exports are coming in, an excess demand will be created in Home and
an excess supply will be created in Foreign, which leads to a price
wedge between Home and Foreign prices. The excess demand pressure
increases the prices in Home country from PH to
PT and the excess supply decreases the prices in Foreign
country from PF to PT*. The volume of trade
declines from QW ( free trade level of trade ) to
QT ( volume of trade with tax ).
In the figure, D2 – S2 = QT.
D1
– S1 = QW.
The intersection of the world demand and world supply gives the
equilibrium world price, PW. At equilibrium level,
Imports by Home = Exports by Foreign
⇒ Home Demand – Home Supply = Foreign
Supply – Foreign Demand
⇒ Home Demand + Foreign Demand = Foreign Supply + Home Supply
⇒ World
Demand = World Supply
Hence, we get,
(200 – 2 PW) + (100 – ½ PW) = 2PW
+ 4PW
300 – 5/2 PW = 6PW
$600/17 = PW
or $35.29 = PW
Now, let QW = Equilibrium level of Quantity traded in
World Market,
Therefore, in terms of quantity,
(100 – ½ QW) + (200 – 2QW) = ¼ QW
+ ½ QW
300 – 5/2 QW = ¾ QW
300 = 13/4QW
1200/13 = QW
or 92.31 =
QW
At QW, Home Import Demand = Foreign Export Supply, that
is, MD = XS
when PT – PT* = T, that is, PT –
PT* = $2.
Home Import Demand = Home Demand – Home Supply
MD = 200 – 2 PT – 2 PT
= 200 – 4 PT
or, MD = 100 – ½ QT – ½ QT
= 100 – QT
Foreign Export Supply = Foreign Supply – Foreign Demand
XS = 4P – 100 + ½ PT*
= 9/2 PT* – 100
At QW, Home Import Demand = Foreign Export Supply, that
is, MD = XS
when PT – PT* = T, that is, PT –
PT* = $2.
⇒ PT = $2 + PT*
⇒
200 – 4 PT = 9/2 PT* – 100
⇒ 200 – 4 (2 + PT*) = 9/2 PT* – 100
⇒ 200 – 8 – 4 PT* = 9/2
PT* – 100
⇒
192 +100 = 9/2 PT* + 4 PT*
⇒
292 = 17/2 PT*
⇒
$584/17 = PT*
or $34.35 = PT*
As we know, PT = $2 + PT*
⇒ PT = $2 + $584/17
= $618/17 or
$36.35
1. c. As seen in part (b), import tax raises the prices in Home
from PH to PT and lowers the prices in
Foreign from PF to PT*.
HOME
As shown in the diagram below, the demand in Home decreases from
D1 to D2, and the supply increases from
S1 to S2.
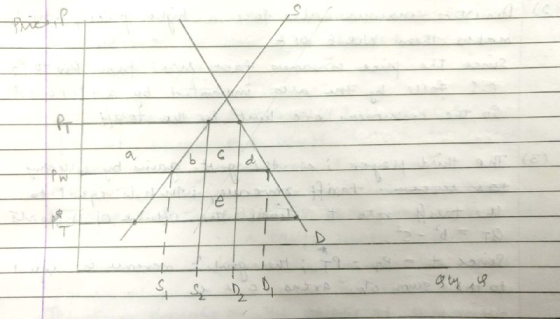
D1 = 200 – 2PW = 200 – 2(600/17) =
2200/17
= 129.41.
D2 = 200 – 2 PT = 200 – (618/17) =
2164/17
= 127.29.
S1 = 2 PW = 2 (600/17) = 1200/17
= 70.58.
S2 = 2 PT = 2 (618/17) = 1236/17
= 76.98.
Now,
Area (a + b) = (S2 – 0) (PT – PW)
= 1236/17 (618/17 – 600/17) = 22248/289
= 76.98.
Area b = ½ (
S2 – S1) (PT – PW) = ½
(1236/17 – 1200/17) (618/17 – 600/17) = 324/298
= 1.12.
Area c = (D2
- S2) (PT – PW) = (2164/17 –
1236/17) (618/17 – 600/17) = 16704/289
= 57.79.
Area d = ½
(D1 – D2) (PT – PW) = ½
(2200/17 – 2164/17) (618/17 – 600/17) = 324/289
= 1.12
Area (c + e) = tax rate x (D2 - S2) = 2 x
(2164/17 – 1236/17) = 1856/17
= 109.18
1. Consumer Surplus : Consumer surplus is given by the area below
demand curve and above price line. Hence, increase in price lowers
the consumer surplus by an area of a+b+c+d, as shown in the
figure.
Change in Consumer Surplus = Area (a + b + c + d)
= 22248/289 + 16704/289 + 324/289
= 39276/289
=
135.9
2. Producer Surplus : Producer Surplus is the area below price line
and above the supply curve. Hence, increase in prices leads to an
increase in producer surplus by an amount of area a, as shown in
the figure.
Change in Producer Surplus = Area (a + b) – Area b
= 22248/289 – 324/289
= 21924/289
= 75.86
3. Revenue : Home Government receives revenue when an import tax is
imposed, the value of which is given by tax rate times the import
volume.
Here, Import Volume = D2 – S2
Revenue = tax rate x Import Volume = Area (c + e) = 1856/17 =
109.18.
Net Cost of Import Tax = Consumer Loss – Producer Gain – Government
Revenue
= (a + b +c + d) – a – (c + e)
= b + d – e
Thus,
Total Change in Social Surplus = e – (b + d)
=
1856/17 – 324/289 – 324/289
= 30904/289
= 106.93
FOREIGN
As shown in the diagram below, the demand in Foreign increases from
D1* to D2*, and the supply decreases from
S1* to S2*.

D1* = 100 – ½ PW = 100 – ½ (600/17) =
1400/17
= 82.35
D2* = 100 – ½ PT* = 100 – ½ (584/17) =
1408/17
= 82.82.
S1* = 4 PW = 4 (600/17) = 2400/17
= 141.18.
S2* = 4 PT* = 4 (584/17) = 2336/17
= 137.41.
Now,
Area c = ½ ( D2* -
D1*) (PW – PT*) = ½ ( 1408/17 –
1400/17) (600/17 – 584/17) = 64/289
= 0.22.
Area d = (S2* - D2*)
(PW – PT*) = (2336/17 – 1408/17) (600/17 –
584/17) = 14848/17
=
51.38.
Area e = ½ ( S1* -
S2*) (PW – PT*) = ½ (2400/17 –
2336/17) (600/17 – 584/17)
= 1.77.
Area (a + b) = Area ( a + b + c ) – Area c
= (D2* – 0) (PW – PT*) – Area c =
1408/17 (600/17 – 584/17) – 64/289 = 22464/289
=
77.73.
1. Consumer Surplus : Consumer surplus is given by the area below
demand curve and above price line. Hence, decrease in price
increases the consumer surplus by an area of a+b, as shown in the
figure.
Change in Consumer Surplus = Area (a + b)
= 22464/289
=
77.73.
2. Producer Surplus : Producer Surplus is the area below price line
and above the supply curve. Hence, decrease in prices leads to
decrease in producer surplus by an amount of area (a + b + c + d +
e), as shown in the figure.
Change in Producer Surplus = Area (a +b) + Area c + Area d + Area
e
= 22464/289 + 64/289 + 14848/289 + 512/289
=
37888/289
=
131.1.
3. Revenue : Foreign Government receives no revenue when an import
tax is imposed by Home country, hence Foreign Government revenue is
ZERO.
Thus,
Change in Total Social Surplus = Gain from Consumer Surplus – Loss
in Production Surplus
= (a + b) – (a + b + c + d + e)
=
- (c + d + e)
= - (64/589 + 14848/589 + 572/589)
= - 15424/289
=
- 53.37.
1. d. HOME
From part (c), we know that,
Net Cost of Import Tax = Consumer Loss – Producer Gain – Government
Revenue
= (a + b +c + d) – a – (c + e)
= b + d – e
or, Total Change in Social Surplus = e – (b + d)
Areas b and d are 2 triangles that measure the efficiency loss
resulting from -
1. Production distortion loss due to excess production.
2. Consumption distortion loss due to too little consumption.
Rectangle e represents the gains from terms of trade, which result
due to decline in export prices from PW to
PT*.
Terms of trade in the ratio of a country’s export prices to its
import prices. Reduction in foreign export prices implies that
domestic import prices fall, and therefore terms of trade for Home
country improve.
Here, loss from b & d = 324/289 + 324/289 = 648/289
Gain from e = 1856/17.
Total Change in Social Surplus = e – (b + d)
= 1856/17 – 324/289 – 324/289
= 30904/289
= 106.93
Hence, the terms of trade gain to Home is higher than the
efficiency loss due to production and consumption distortions.
Thus, the importer gains from import tax.
FOREIGN
From part (c), we know that,
Change is Total Social Surplus = Gain from Consumer Surplus – Loss
in Production Surplus
= (a + – (a + b + c + d + e)
= - (c + d + e)
Areas e and c are 2 triangles that measure the efficiency loss
resulting from -
1. Production distortion loss due to too little production.
2. Consumption distortion loss due to excess consumption.
Rectangle d represents the negative terms of trade effect, which
results due to decline in export prices from PW to
PT*.
Change in Total Social Surplus = Gain from Consumer Surplus – Loss
in Production Surplus
=
(a + – (a + b + c + d + e)
= - (c + d + e)
= - (64/589 + 14848/589 + 572/589)
=
- 15424/289
= - 53.37.
The loss from producer loss outweighs gain from consumer surplus,
hence, the exporter does not gain from the imposition of import
tax.
1. d. For optimal tax rate,
Marginal gain from terms of trade = Efficiency loss from
Consumption &
Production distortions
Area
e = Area ( b + d )
Area ( c + e ) – Area c = Area b + Area d
optimal tax rate x (D2 - S2) – (D2
- S2) (PT – PW) = ½ (
S2 – S1) (PT – PW) + ½
(D1 – D2) (PT –
PW)
t*
x (D2 - S2) – (D2 - S2)
(PT – PW) = ½ (PT – PW)
[( S2 – S1) + (D1 –
D2)]
(D2
- S2) [ t* – (PT – PW) ] = ½
(PT – PW) [( S2 – D2) +
(D1 – S1)]
In part (b), we saw that, D2 – S2 =
QT.
D1 – S1 = QW.
Using above mentioned expressions,
⇒ (QT) [ t* – (PT –
PW) ] = ½ (PT – PW) [(–
QT) + QW]


The above expression gives the optimal tax rate for the
importer.
Add Answer to:
TARIFFS PARTIAL EQUILIBRIUM DUE: Suppose we have the following demand and supply functions (taken from Assignment...
Suppose we have the following demand and supply functions (taken from Ass HOME Demand P 100-...
 Suppose we have the following demand and supply functions (taken from Ass HOME Demand P 100- 2Q Suppl PhQ FOREIGN Demand P 2002Q Supply P Q 2: Two-country model with EXPORT TARIFFS: use the functions above. Suppose the exporter imposes an export tax of S2 per unit. Calculate the new equilibrium world price. What are the tariff-ridden domestic prices? (2 points) a) Find the change in Consumer and Producer Surplus in each country. Recall that export tariffs need to be...
Suppose we have the following demand and supply functions (taken from Ass HOME Demand P 100-...
 Suppose we have the following demand and supply functions (taken from Ass HOME Demand P 100- 2Q Suppl PhQ FOREIGN Demand P 2002Q Supply P Q 3: Two-country model with import and export tariffs: use the functions above. Suppose the exporter imposes an export tax of $2 per unit and the importer imposes an import tax of $2 per unit b) d) (3 points) Calculate the new equilibrium world price and domestic prices. (7 points) Does the importer gain from...
Roblem 2: Trade Policy. demand for cars in Home is q 30 - P and the supply of cars in Home is q -...
 E-H ONLY. THERE ARE THREE PICTURES
updated figure 2
roblem 2: Trade Policy. demand for cars in Home is q 30 - P and the supply of cars in Home is q -P. The demand for cars in Foreign is q 20-P and the supply of cars in Foreign is q P. a) Calculate the equilibrium price and quantity in each country under isolation. b) Who is the importer of cars and who is the exporter? c) Write the import...
E-H ONLY. THERE ARE THREE PICTURES
updated figure 2
roblem 2: Trade Policy. demand for cars in Home is q 30 - P and the supply of cars in Home is q -P. The demand for cars in Foreign is q 20-P and the supply of cars in Foreign is q P. a) Calculate the equilibrium price and quantity in each country under isolation. b) Who is the importer of cars and who is the exporter? c) Write the import...
GS eans government surplus Problem IV. Demand and supply curves for two large countries are given...
 GS
eans government surplus
Problem IV. Demand and supply curves for two large countries are given by figure 1. Answer the following questions. (38 points) 1. Consider the autarky situation. (a) Calculate CS, PS, GS, and TS for both countries. (3 povints) 2. Now, suppose countries open to trade. (a) Which country imports and which exports? (0.5 point) (1) Derive import demand for importer and export supply for exporter. You can either draw both curves with appropriate labeling and placing...
GS
eans government surplus
Problem IV. Demand and supply curves for two large countries are given by figure 1. Answer the following questions. (38 points) 1. Consider the autarky situation. (a) Calculate CS, PS, GS, and TS for both countries. (3 povints) 2. Now, suppose countries open to trade. (a) Which country imports and which exports? (0.5 point) (1) Derive import demand for importer and export supply for exporter. You can either draw both curves with appropriate labeling and placing...
Problem IV. Demand and supply curves for two large countries are given by figure 1. Answer...
 Problem IV. Demand and supply curves for two large countries are given by figure 1. Answer the following questions. (38 points) 1. Consider the autarky situation. (a) Calculate CS, PS, GS, and TS for both countries. (3 povints) 2. Now, suppose countries open to trade. (a) Which country imports and which exports? (0.5 point) (1) Derive import demand for importer and export supply for exporter. You can either draw both curves with appropriate labeling and placing numbers or write equations....
Problem IV. Demand and supply curves for two large countries are given by figure 1. Answer...
 Problem IV. Demand and supply curves for two large countries are given by figure 1. Answer the following 1. Consider the autarky situation. (a) Calculate CS, PS, GS, and TS for both countries (3 points) 2. Now, suppo countries open to trade (a) Which country imports and which exports? (0.5 point) (b) Derive import demand for importer and export supply for exporter. You can either drawe both curves with appropriate labeling and placing numbers or write equations. ( points) (e)...
33. The following diagram shows the domestic demand and supply curves for sunglasses. Assume that...
 33. The following diagram shows the domestic demand and supply curves for sunglasses. Assume that the world price for sunglasses is $10 per unit. 60 50 45 40 35 30 20 15 10 200 400 600 800 1000 Part : With no trade allowed, what are the equilibrium price and equilibrium quantity for sunglasses? Part 2: If the country allows free trade, (a) how many sunglasses will domestic consumers demand and how many sunglasses will domestic producers produce? (b) Will...
3. The following diagram shows the domestic demand and supply curves for sunglasses. Assume that the...
 3. The following diagram shows the domestic demand and supply curves for sunglasses. Assume that the world price for sunglasses is S10 per unit. 60 50 45 40 35 30 20 15 10 200 400 600 800 1000 Part 1: With no trade allowed, what are the equilibrium price and equilibrium quantity for sunglasses? Part 2: If the country allows free trade, (a) how many sunglasses will domestic consumers demand and how many sunglasses will domestic producers produce? (b) Will...
Problem 1 Below, you are provided with the demand and supply curves for t-shirts and the...
 Problem
1
Below, you are
provided with the demand and supply curves for t-shirts and the
world price of a t-shirt. You will usethis information to identify
whether the country imports or exports t-shirts. You will also
examine the impact of a tariffon the amount of consumer and
producer surplus that results in this market.
Suppose that the world price of a t-shirt is $20. Does this
country import or export t-shirts? How many?
Suppose that this country engages in...
Problem
1
Below, you are
provided with the demand and supply curves for t-shirts and the
world price of a t-shirt. You will usethis information to identify
whether the country imports or exports t-shirts. You will also
examine the impact of a tariffon the amount of consumer and
producer surplus that results in this market.
Suppose that the world price of a t-shirt is $20. Does this
country import or export t-shirts? How many?
Suppose that this country engages in...
can you answer question 3 only plz thank you i need it as soon as possible Home demand: D 100-20P Home supply: S 30+20P What is the import demand schedule in home country, what is the equilibrium...
 can you answer question 3 only plz thank you i need it as soon
as possible
Home demand: D 100-20P Home supply: S 30+20P What is the import demand schedule in home country, what is the equilibrium price without trade? b Please draw the demand and supply curves at home, calculate and mark domestic consumer surplus and producer surplus without trade on the graph. 2 Foreign demand D 80-20P* Foreign supply: S 50 20P* What is the export supply schedule...
can you answer question 3 only plz thank you i need it as soon
as possible
Home demand: D 100-20P Home supply: S 30+20P What is the import demand schedule in home country, what is the equilibrium price without trade? b Please draw the demand and supply curves at home, calculate and mark domestic consumer surplus and producer surplus without trade on the graph. 2 Foreign demand D 80-20P* Foreign supply: S 50 20P* What is the export supply schedule...
 Suppose we have the following demand and supply functions (taken from Ass HOME Demand P 100- 2Q Suppl PhQ FOREIGN Demand P 2002Q Supply P Q 2: Two-country model with EXPORT TARIFFS: use the functions above. Suppose the exporter imposes an export tax of S2 per unit. Calculate the new equilibrium world price. What are the tariff-ridden domestic prices? (2 points) a) Find the change in Consumer and Producer Surplus in each country. Recall that export tariffs need to be...
 Suppose we have the following demand and supply functions (taken from Ass HOME Demand P 100- 2Q Suppl PhQ FOREIGN Demand P 2002Q Supply P Q 3: Two-country model with import and export tariffs: use the functions above. Suppose the exporter imposes an export tax of $2 per unit and the importer imposes an import tax of $2 per unit b) d) (3 points) Calculate the new equilibrium world price and domestic prices. (7 points) Does the importer gain from...
 E-H ONLY. THERE ARE THREE PICTURES
updated figure 2
roblem 2: Trade Policy. demand for cars in Home is q 30 - P and the supply of cars in Home is q -P. The demand for cars in Foreign is q 20-P and the supply of cars in Foreign is q P. a) Calculate the equilibrium price and quantity in each country under isolation. b) Who is the importer of cars and who is the exporter? c) Write the import...
E-H ONLY. THERE ARE THREE PICTURES
updated figure 2
roblem 2: Trade Policy. demand for cars in Home is q 30 - P and the supply of cars in Home is q -P. The demand for cars in Foreign is q 20-P and the supply of cars in Foreign is q P. a) Calculate the equilibrium price and quantity in each country under isolation. b) Who is the importer of cars and who is the exporter? c) Write the import...
 GS
eans government surplus
Problem IV. Demand and supply curves for two large countries are given by figure 1. Answer the following questions. (38 points) 1. Consider the autarky situation. (a) Calculate CS, PS, GS, and TS for both countries. (3 povints) 2. Now, suppose countries open to trade. (a) Which country imports and which exports? (0.5 point) (1) Derive import demand for importer and export supply for exporter. You can either draw both curves with appropriate labeling and placing...
GS
eans government surplus
Problem IV. Demand and supply curves for two large countries are given by figure 1. Answer the following questions. (38 points) 1. Consider the autarky situation. (a) Calculate CS, PS, GS, and TS for both countries. (3 povints) 2. Now, suppose countries open to trade. (a) Which country imports and which exports? (0.5 point) (1) Derive import demand for importer and export supply for exporter. You can either draw both curves with appropriate labeling and placing...
 Problem IV. Demand and supply curves for two large countries are given by figure 1. Answer the following questions. (38 points) 1. Consider the autarky situation. (a) Calculate CS, PS, GS, and TS for both countries. (3 povints) 2. Now, suppose countries open to trade. (a) Which country imports and which exports? (0.5 point) (1) Derive import demand for importer and export supply for exporter. You can either draw both curves with appropriate labeling and placing numbers or write equations....
 Problem IV. Demand and supply curves for two large countries are given by figure 1. Answer the following 1. Consider the autarky situation. (a) Calculate CS, PS, GS, and TS for both countries (3 points) 2. Now, suppo countries open to trade (a) Which country imports and which exports? (0.5 point) (b) Derive import demand for importer and export supply for exporter. You can either drawe both curves with appropriate labeling and placing numbers or write equations. ( points) (e)...
 33. The following diagram shows the domestic demand and supply curves for sunglasses. Assume that the world price for sunglasses is $10 per unit. 60 50 45 40 35 30 20 15 10 200 400 600 800 1000 Part : With no trade allowed, what are the equilibrium price and equilibrium quantity for sunglasses? Part 2: If the country allows free trade, (a) how many sunglasses will domestic consumers demand and how many sunglasses will domestic producers produce? (b) Will...
 3. The following diagram shows the domestic demand and supply curves for sunglasses. Assume that the world price for sunglasses is S10 per unit. 60 50 45 40 35 30 20 15 10 200 400 600 800 1000 Part 1: With no trade allowed, what are the equilibrium price and equilibrium quantity for sunglasses? Part 2: If the country allows free trade, (a) how many sunglasses will domestic consumers demand and how many sunglasses will domestic producers produce? (b) Will...
 Problem
1
Below, you are
provided with the demand and supply curves for t-shirts and the
world price of a t-shirt. You will usethis information to identify
whether the country imports or exports t-shirts. You will also
examine the impact of a tariffon the amount of consumer and
producer surplus that results in this market.
Suppose that the world price of a t-shirt is $20. Does this
country import or export t-shirts? How many?
Suppose that this country engages in...
Problem
1
Below, you are
provided with the demand and supply curves for t-shirts and the
world price of a t-shirt. You will usethis information to identify
whether the country imports or exports t-shirts. You will also
examine the impact of a tariffon the amount of consumer and
producer surplus that results in this market.
Suppose that the world price of a t-shirt is $20. Does this
country import or export t-shirts? How many?
Suppose that this country engages in...
 can you answer question 3 only plz thank you i need it as soon
as possible
Home demand: D 100-20P Home supply: S 30+20P What is the import demand schedule in home country, what is the equilibrium price without trade? b Please draw the demand and supply curves at home, calculate and mark domestic consumer surplus and producer surplus without trade on the graph. 2 Foreign demand D 80-20P* Foreign supply: S 50 20P* What is the export supply schedule...
can you answer question 3 only plz thank you i need it as soon
as possible
Home demand: D 100-20P Home supply: S 30+20P What is the import demand schedule in home country, what is the equilibrium price without trade? b Please draw the demand and supply curves at home, calculate and mark domestic consumer surplus and producer surplus without trade on the graph. 2 Foreign demand D 80-20P* Foreign supply: S 50 20P* What is the export supply schedule...
Most questions answered within 3 hours.
-
What is the frequency of the second hand of a clock, assuming it
is keeping correct...
asked 30 seconds from now -
Determine Heat of reaction (Hrxn) for: 2 C (s, graphite) + 3 H2
(g) ------> C2H6...
asked 17 minutes ago -
A 270 pF capacitor is charged to a potential difference of 120
V, and the charging...
asked 19 minutes ago -
1.8 zyLab training: Basics (Java)
While the zyLab platform can be used without training, a bit...
asked 21 minutes ago -
The figure below shows an electron passing between two charged
metal plates that create an 100...
asked 24 minutes ago -
A) Calculate the final temperature, in degrees Celsius,
if n and V do not change.
A...
asked 27 minutes ago -
Find the 60th percentile of a standard normal
distribution(3 decimal places) on StatCrunch
asked 41 minutes ago -
This week we discuss the properly classified Balance Sheet.
Recall that the value of assets is...
asked 40 minutes ago -
Determine the molar concentration of Cl- ions in a 1.00 M
solution of AgCl2- with no...
asked 46 minutes ago -
You work for a defense company in their characterization
department. Your superior brings you 0.5 g...
asked 55 minutes ago -
An elevator has a placard stating that the maximum capacity is
1600lb—10 passengers. So, 10 adult...
asked 58 minutes ago -
The special causes of variation ________.
A) cannot be identified
B) cannot be eliminated
C) cannot...
asked 1 hour ago