SUMIFs formula to find the data below. The data set is too large, I know how...
SUMIFs formula to find the data below. The data set is too large, I know how to write two different formulas to find revenue and quantity, but I need to create one function that can be copied across and down the table
| Table 1 - Total Revenue and Quantity Sold by Country | ||
| Retailer country | Revenue | Quantity |
| Mexico | ||
| Netherlands | ||
| Singapore | ||
| Spain | ||
| Sweden | ||
| Switzerland | ||
| United Kingdom | ||
| United States | $650,810,961 | 11,841,817 |
Homework Answers
To copy the SUMIF formula down and across, we will need that the data at the source file is arranged in the same way as shown in the report. Please consider the following steps :
1.Since the Revenue & Quantity are arranged in two consecutive columns in the summary sheet, they are arranged in two consecutive columns of the data sheet also.
2. The formula to be used should be such that when copying across, the SUMIF parameter (" Retailer Country") column should not change both in the Data sheet as well as the Report sheet.
3. The formula to be used would be as under:
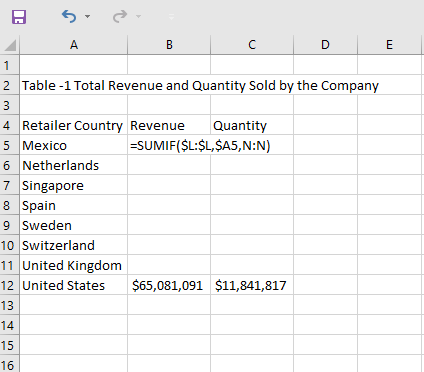
It has been assumed that " Column L" in the data sheet contains the " Retailer Country ". Once we use this formula, we affiix the "S" sign against the parameters which we want to remain unchanged.
If we want a column to remain unchanged, we would use the $ sign only against the column no.
example
1. =SUMIF(L:L,$A5,N:N) makes the column "A" fixed, it would not change if we move across to the next column.However if we move down to next cell it would change and would appear as =SUMIF(L:L,$A6,N:N)
2. If we want a cell to remain unchanged, we will would use $ sign both against the column no, and the cell no.
In the above mentioned example, if we use the formula as =SUMIF(L:L,$A$5,N:N),the selection parameter would not change if we move across or up-down.
We would use the formula as given in example 1 because the selection parameter (Retailer Country) changes if we go down the column but would not change if we go across.
Add Answer to:
SUMIFs formula to find the data below. The data set is too
large, I know how...
6. The table below contains data on income inequality and infant mortality for 21 OECD countries....
 6. The table below contains data on income inequality and infant mortality for 21 OECD countries. Income inequality is measured as the 20:20 income ratio, which compares the average income for the top 20% of earners to the average income for the bottom 20%. The infant mortality rate refers to infant deaths in the first vear of life. It is measured as the rate per 1,000 live births in the population. Does inequality affect infant mortality across OECD countries? For...
Country Suicides/ 100,000 Guatemala 2.5 United Arab Emirates 2.9 Venezuela, RB 3 Algeria 3.1 Lebanon 3.1...
Country Suicides/ 100,000 Guatemala 2.5 United Arab Emirates 2.9 Venezuela, RB 3 Algeria 3.1 Lebanon 3.1 Myanmar 4.3 Greece 4.3 Mexico 5 Israel 5.5 Tunisia 5.5 Peru 5.8 Malta 6 Colombia 6.1 Brazil 6.3 Kenya 6.5 Ghana 6.9 Ecuador 7.5 Italy 7.9 Ethiopia 8.4 Spain 8.5 United Kingdom 8.5 Turkey 8.7 Burkina Faso 9.2 Nicaragua 9.5 China 10 Norway 10.9 Luxembourg 11.1 Ireland 11.7 Australia 11.8 New Zealand 11.9 Denmark 12.2 Canada 12.3 Netherlands 12.6 Iceland 13.1 Germany 13.4 Portugal...
5. Write sentences that interpret the slope and y-intercept of the LSRL. 6. Superimpose the regression...
 5. Write sentences that interpret the slope and y-intercept of
the LSRL.
6. Superimpose the regression equation on the scatterplot.
7. Predict the rate of heart attacks for a country where the
average wine consumption is 3 liters/person/year.
8. Would it be appropriate to try to predict the death rate from
heart attacks for Estonia where the per capita wine consumption is
15 liters/year? Why or why not?
9. What is the explained variation for this data? Interpret your
result....
5. Write sentences that interpret the slope and y-intercept of
the LSRL.
6. Superimpose the regression equation on the scatterplot.
7. Predict the rate of heart attacks for a country where the
average wine consumption is 3 liters/person/year.
8. Would it be appropriate to try to predict the death rate from
heart attacks for Estonia where the per capita wine consumption is
15 liters/year? Why or why not?
9. What is the explained variation for this data? Interpret your
result....
I need help from 9-11. I calculated 7-8 below. 7)Alcohol Consumption (liters/person/year): 3 Heart disease = 260.56-22.969(3) = 191.653 8) Alcohol Consumption (liters/pers...
 I need help from 9-11.
I calculated 7-8 below.
7)Alcohol Consumption (liters/person/year): 3
Heart disease =
260.56-22.969(3)
= 191.653
8) Alcohol Consumption (liters/person/year): 15
Heart disease =
260.56-22.969(15)
= -83.975
It wouldn’t be appropriate because the heart disease is
in -83.975.
The following table presents data on wine consumption (in liters per person per year) and death rate from heart attacks (in deaths per 100,000 people per year) in 19 developed Western countries. WINE CONSUMPTION AND HEART ATTACKS Alcohol Heart...
I need help from 9-11.
I calculated 7-8 below.
7)Alcohol Consumption (liters/person/year): 3
Heart disease =
260.56-22.969(3)
= 191.653
8) Alcohol Consumption (liters/person/year): 15
Heart disease =
260.56-22.969(15)
= -83.975
It wouldn’t be appropriate because the heart disease is
in -83.975.
The following table presents data on wine consumption (in liters per person per year) and death rate from heart attacks (in deaths per 100,000 people per year) in 19 developed Western countries. WINE CONSUMPTION AND HEART ATTACKS Alcohol Heart...
R programming R1. Below is a table showing a variety of countries (first column), the number of cigarettes consumed...
 R programming
R1. Below is a table showing a variety of countries (first column), the number of cigarettes consumed per adult per year (second column), and the rate at which people die from coronary heart disease CHD) per 100,000 people (third column). Put these data into a dataframe in R. Then run a linear regression that examines how CHD rates (response variable) are predicted by cigarette consumption (predictor variable). What is the equation of the regression line you get? What...
R programming
R1. Below is a table showing a variety of countries (first column), the number of cigarettes consumed per adult per year (second column), and the rate at which people die from coronary heart disease CHD) per 100,000 people (third column). Put these data into a dataframe in R. Then run a linear regression that examines how CHD rates (response variable) are predicted by cigarette consumption (predictor variable). What is the equation of the regression line you get? What...
2. Pittman's Fireplaces Percy Pittman recently took over the family business. Pittman's Fireplaces has been in business since 1922. It was started by Percy's grandfather and then passed o...
 2. Pittman's Fireplaces Percy Pittman recently took over the family business. Pittman's Fireplaces has been in business since 1922. It was started by Percy's grandfather and then passed on to Percy's father. The business has thrived. They install fireplaces throughout the United States In addition to the fireplaces, Pittman's Fireplaces sells all the accessories you can imag ine to make your fireplace the centerpiece of your room. Percy wants to take the business to the next level and go international....
Q: The table shows the 2013 per capita total expenditure on health in 3535 countries with...
Q: The table shows the 2013 per capita total expenditure on health in 3535 countries with the highest gross domestic product in that year. Health expenditure per capita is the sum of public and private heath expenditure (in PPP, international $) divided by population. Health expenditures include the provision of health services, family‑planning activities, nutrition activities, and emergency aid designated for health but exclude the provision of water and sanitation. Per capita total expenditure on health (international dollars) Country Dollars...
HI, I need help with this question. Please answer in details. The data set is found below for eac...
 HI, I need help with this question. Please answer in details.
The data set is found below for each countries sugar consumption.
Thanks!
Country,Sugar, GDP, Continent Albania,15.3,4556.144342, Europe Argentina, 38.1,13693.70379, South America Armenia, 33.2,3421.704509, Europe Australia, 34.1, 62080.98242, Europe Austria, 37.9,49485.48219, Europe Azerbaijan,13.9,7189.691229, Europe Belarus,31.8,6305.773662, Europe Belgium, 41.4,46463.60378, Europe Bosnia and Herzegovina,13.4,4754.197861, Europe Brazil, 36.5,12576.19559, South America Canada, 31.3,51790.56695, North America Chile, 41.7,14510.9661, South America China, 6.2,5447.309378,Asia Colombia,23.2, 7124.54892, South America Czech Republic, 30.6,20584.92655, Europe Denmark, 38,59911.90466,Europe Egypt, 26.4,2972.583516,Africa Estonia,31.4,16982.30031,...
HI, I need help with this question. Please answer in details.
The data set is found below for each countries sugar consumption.
Thanks!
Country,Sugar, GDP, Continent Albania,15.3,4556.144342, Europe Argentina, 38.1,13693.70379, South America Armenia, 33.2,3421.704509, Europe Australia, 34.1, 62080.98242, Europe Austria, 37.9,49485.48219, Europe Azerbaijan,13.9,7189.691229, Europe Belarus,31.8,6305.773662, Europe Belgium, 41.4,46463.60378, Europe Bosnia and Herzegovina,13.4,4754.197861, Europe Brazil, 36.5,12576.19559, South America Canada, 31.3,51790.56695, North America Chile, 41.7,14510.9661, South America China, 6.2,5447.309378,Asia Colombia,23.2, 7124.54892, South America Czech Republic, 30.6,20584.92655, Europe Denmark, 38,59911.90466,Europe Egypt, 26.4,2972.583516,Africa Estonia,31.4,16982.30031,...
Plush Decor, Inc., is considering three possible countries for the sole manufacturing site of its newest...
 Plush Decor, Inc., is considering three possible countries for the sole manufacturing site of its newest area rug: Singapore, Brazil, and Spain. All area rugs are to be sold to retail outlets in the United States for $290 per unit. These retail outlets add their own markup when selling to final customers. Fixed costs and variable cost per unit (area rug) differ in the three countries. E: (Click the icon to view the cost data.) Read the requirements. Requirement 1....
22 Use data_Americas. Plot year vs gdpPercap. Scale gdpPercap by log10. Color the data by country....
22 Use data_Americas. Plot year vs gdpPercap. Scale gdpPercap by log10. Color the data by country. 23 Use data_Americas. Plot year vs gdpPercap. Scale gdpPercap by log10. Color the data by country and size by pop. Looking for the answers in R command codes. 1952 1957 1962 1967 1972 1977 1982 1987 1992 1997 2002 2007 142 142 142 142 142 142 142 142 142 142 142 142 > table(gapminder$country) Afghanistan Albania Algeria 12 12 12 Angola Argentina Australia 12...
 6. The table below contains data on income inequality and infant mortality for 21 OECD countries. Income inequality is measured as the 20:20 income ratio, which compares the average income for the top 20% of earners to the average income for the bottom 20%. The infant mortality rate refers to infant deaths in the first vear of life. It is measured as the rate per 1,000 live births in the population. Does inequality affect infant mortality across OECD countries? For...
 5. Write sentences that interpret the slope and y-intercept of
the LSRL.
6. Superimpose the regression equation on the scatterplot.
7. Predict the rate of heart attacks for a country where the
average wine consumption is 3 liters/person/year.
8. Would it be appropriate to try to predict the death rate from
heart attacks for Estonia where the per capita wine consumption is
15 liters/year? Why or why not?
9. What is the explained variation for this data? Interpret your
result....
5. Write sentences that interpret the slope and y-intercept of
the LSRL.
6. Superimpose the regression equation on the scatterplot.
7. Predict the rate of heart attacks for a country where the
average wine consumption is 3 liters/person/year.
8. Would it be appropriate to try to predict the death rate from
heart attacks for Estonia where the per capita wine consumption is
15 liters/year? Why or why not?
9. What is the explained variation for this data? Interpret your
result....
 I need help from 9-11.
I calculated 7-8 below.
7)Alcohol Consumption (liters/person/year): 3
Heart disease =
260.56-22.969(3)
= 191.653
8) Alcohol Consumption (liters/person/year): 15
Heart disease =
260.56-22.969(15)
= -83.975
It wouldn’t be appropriate because the heart disease is
in -83.975.
The following table presents data on wine consumption (in liters per person per year) and death rate from heart attacks (in deaths per 100,000 people per year) in 19 developed Western countries. WINE CONSUMPTION AND HEART ATTACKS Alcohol Heart...
I need help from 9-11.
I calculated 7-8 below.
7)Alcohol Consumption (liters/person/year): 3
Heart disease =
260.56-22.969(3)
= 191.653
8) Alcohol Consumption (liters/person/year): 15
Heart disease =
260.56-22.969(15)
= -83.975
It wouldn’t be appropriate because the heart disease is
in -83.975.
The following table presents data on wine consumption (in liters per person per year) and death rate from heart attacks (in deaths per 100,000 people per year) in 19 developed Western countries. WINE CONSUMPTION AND HEART ATTACKS Alcohol Heart...
 R programming
R1. Below is a table showing a variety of countries (first column), the number of cigarettes consumed per adult per year (second column), and the rate at which people die from coronary heart disease CHD) per 100,000 people (third column). Put these data into a dataframe in R. Then run a linear regression that examines how CHD rates (response variable) are predicted by cigarette consumption (predictor variable). What is the equation of the regression line you get? What...
R programming
R1. Below is a table showing a variety of countries (first column), the number of cigarettes consumed per adult per year (second column), and the rate at which people die from coronary heart disease CHD) per 100,000 people (third column). Put these data into a dataframe in R. Then run a linear regression that examines how CHD rates (response variable) are predicted by cigarette consumption (predictor variable). What is the equation of the regression line you get? What...
 2. Pittman's Fireplaces Percy Pittman recently took over the family business. Pittman's Fireplaces has been in business since 1922. It was started by Percy's grandfather and then passed on to Percy's father. The business has thrived. They install fireplaces throughout the United States In addition to the fireplaces, Pittman's Fireplaces sells all the accessories you can imag ine to make your fireplace the centerpiece of your room. Percy wants to take the business to the next level and go international....
 HI, I need help with this question. Please answer in details.
The data set is found below for each countries sugar consumption.
Thanks!
Country,Sugar, GDP, Continent Albania,15.3,4556.144342, Europe Argentina, 38.1,13693.70379, South America Armenia, 33.2,3421.704509, Europe Australia, 34.1, 62080.98242, Europe Austria, 37.9,49485.48219, Europe Azerbaijan,13.9,7189.691229, Europe Belarus,31.8,6305.773662, Europe Belgium, 41.4,46463.60378, Europe Bosnia and Herzegovina,13.4,4754.197861, Europe Brazil, 36.5,12576.19559, South America Canada, 31.3,51790.56695, North America Chile, 41.7,14510.9661, South America China, 6.2,5447.309378,Asia Colombia,23.2, 7124.54892, South America Czech Republic, 30.6,20584.92655, Europe Denmark, 38,59911.90466,Europe Egypt, 26.4,2972.583516,Africa Estonia,31.4,16982.30031,...
HI, I need help with this question. Please answer in details.
The data set is found below for each countries sugar consumption.
Thanks!
Country,Sugar, GDP, Continent Albania,15.3,4556.144342, Europe Argentina, 38.1,13693.70379, South America Armenia, 33.2,3421.704509, Europe Australia, 34.1, 62080.98242, Europe Austria, 37.9,49485.48219, Europe Azerbaijan,13.9,7189.691229, Europe Belarus,31.8,6305.773662, Europe Belgium, 41.4,46463.60378, Europe Bosnia and Herzegovina,13.4,4754.197861, Europe Brazil, 36.5,12576.19559, South America Canada, 31.3,51790.56695, North America Chile, 41.7,14510.9661, South America China, 6.2,5447.309378,Asia Colombia,23.2, 7124.54892, South America Czech Republic, 30.6,20584.92655, Europe Denmark, 38,59911.90466,Europe Egypt, 26.4,2972.583516,Africa Estonia,31.4,16982.30031,...
 Plush Decor, Inc., is considering three possible countries for the sole manufacturing site of its newest area rug: Singapore, Brazil, and Spain. All area rugs are to be sold to retail outlets in the United States for $290 per unit. These retail outlets add their own markup when selling to final customers. Fixed costs and variable cost per unit (area rug) differ in the three countries. E: (Click the icon to view the cost data.) Read the requirements. Requirement 1....
Most questions answered within 3 hours.
-
A sock stuck to the side of a clothes-dryer barrel has a
centripetal acceleration of 24...
asked 25 minutes ago -
A perfect gas undergoes an isentropic process such that its
volume doubles. If the ratio of...
asked 44 minutes ago -
list the elements in groups 3A to 6A in the same order as in the
periodic...
asked 54 minutes ago -
Estimating effect size. Peng and Chen (2014)
evaluated effect size estimates for various tests. In their...
asked 1 hour ago -
Write a script in MySQL that creates and calls a stored
procedure name test. This procedure...
asked 1 hour ago -
If we test the following: H0: μ = 17
vs. H1: μ ≠ 17 and the...
asked 1 hour ago -
in the past year TVG had revenues of 3 million, cost
of goods sold of $25...
asked 1 hour ago -
4) In a polypeptide, which bond cannot rotate because of its
partial double bond character?
The...
asked 1 hour ago -
Assume that in the short run L = 1,000 and K = 100. 1. What is...
asked 1 hour ago -
At a given temperature, 2.06 atm of H2 and 3.7 atm of Br2 are
mixed and...
asked 1 hour ago -
Sodium reacts with Hydrochloric acid to form sodium chloride and
hydrogen gas. 2Na(s)+ 2 HCl(aq)-> 2...
asked 1 hour ago -
The following circuits (1 & 2) are combined to form a
series-parallel circuit and resulting circuit...
asked 2 hours ago