
%
can you explain how to do this for me
Homework Answers
Solution:-
Mean = 1800, S.D = 75
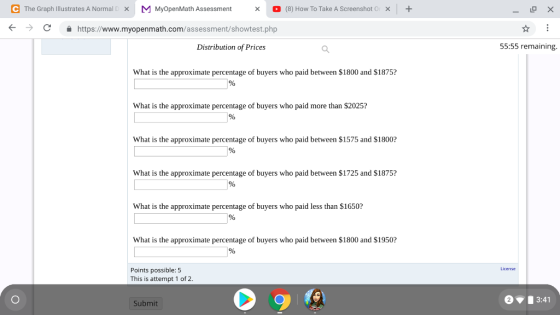
a) The percentage of buyers who paid between $1800 and $1875 is 34.13%.
x1 = 1800
x2 = 1875
By applying normal distribution:-
z1 = 0
z2 = 1.0
P( 0 < z < 1.0) = P(z > 0) - P(z > 1.0)
P( 0 < z < 1.0) = 0.50 - 0.1587
P( 0 < z < 1.0) = 0.3413
b) The approximate percentage of buyers who paid more than $2025 is 0.13%.
x = 2025
By applying normal distribution:-
z = 3.0
P(z > 3.0) = 0.0013
c) The percentage of buyers who paid between $1575 and $1800 is 49.87%.
x1 = 1575
x2 = 1800
By applying normal distribution:-
z1 = -3.0
z2 = 0
P( -3.0 < z < 0) = P(z > -3.0) - P(z > 0)
P( -3.0 < z < 0) = 0.9987 - 0.50
P( -3.0 < z < 0) = 0.4987
d) The percentage of buyers who paid between $1725 and $1875 is 68.26%.
x1 = 1725
x2 = 1875
By applying normal distribution:-
z1 = -1.0
z2 = 1.0
P( -1.0 < z < 1.0) = P(z > -1.0) - P(z > 1.0)
P( -1.0 < z < 1.0) = 0.8413 - 0.1587
P( -1.0 < z < 1.0) = 0.6826
e) The percentage of buyers who paid less than $1650 is 2.28%.
x = 1650
By applying normal distribution:-
z = -2.0
P(z < -2.0) = 0.0228
f) The percentage of buyers who paid between $1800 and $1950 is 47.72%.
x1 = 1800
x2 = 1950
By applying normal distribution:-
z1 = 0
z2 = 2.0
P( 0 < z < 2.0) = P(z > 0) - P(z > 2.0)
P( 0 < z < 2.0) = 0.50 - 0.0228
P( 0 < z < 2.0) = 0.4772
Add Answer to:
%
can you explain how to do this for me
e The Graph Illustrates A Normal[...
The graph illustrates a normal distribution for the prices paid for a particular model of HD...
 The graph illustrates a normal distribution for the prices paid for a particular model of HD television. The mean price paid is $1800 and the standard deviation is $150. 1350 7500 2100 2250 1650 1800 1950 Distribution of Prices What is the approximate percentage of buyers who paid less than $1500? What is the approximate percentage of buyers who paid less than $1350? What is the approximate percentage of buyers who paid between $1650 and $1800? What is the approximate...
The graph illustrates a normal distribution for the prices paid for a particular model of HD...
 The graph illustrates a normal distribution for the prices paid for a particular model of HD television. The mean price paid is $1400 and the standard deviation is $105. + 1085 1190 1295 1400 1505 1610 1715 Distribution of Prices What is the approximate percentage of buyers who paid less than $1190? % What is the approximate percentage of buyers who paid between $1085 and $1400? at% What is the approximate percentage of buyers who paid between $1190 and $1400?...
The graph illustrates a normal distribution for the prices paid for a particular model of HD...
The graph illustrates a normal distribution for the prices paid for a particular model of HD television. The mean price paid is $1200 and the standard deviation is $135. What is the approximate percentage of buyers who paid between $1200 and $1605? % What is the approximate percentage of buyers who paid more than $1470? % What is the approximate percentage of buyers who paid less than $795? % What is the approximate percentage of buyers who paid between $1200...
The graph illustrates a normal distribution for the prices paid for a particular model of HD television. The mean p...
 The graph illustrates a normal distribution for the prices paid for a particular model of HD television. The mean price paid is $1400 and the standard deviation is $105. 1085 1295 1610 1715 1190 1400 1505 Distribution of Prices What is the approximate percentage of buyers who paid less than $1190? 2.5 % What is the approximate percentage of buyers who paid between $1085 and $1400? 4% What is the approximate percentage of buyers who paid between $1190 and $1400?...
The graph illustrates the distribution of test scores taken by College Algebra students. The maximum possible...
 The graph illustrates the distribution of test scores taken by
College Algebra students. The maximum possible score on the test
was 140, while the mean score was 71 and the standard deviation was
15.
1. What is the approximate percentage of students who scored
higher than 101 on the test?
2. What is the approximate percentage of students who scored
between 41 and 101 on the test?
3. What is the approximate percentage of students who scored
lower than 26...
The graph illustrates the distribution of test scores taken by
College Algebra students. The maximum possible score on the test
was 140, while the mean score was 71 and the standard deviation was
15.
1. What is the approximate percentage of students who scored
higher than 101 on the test?
2. What is the approximate percentage of students who scored
between 41 and 101 on the test?
3. What is the approximate percentage of students who scored
lower than 26...
-99.7% -95% 68% The figure illustrates a normal distribution for the prices paid for a particular...
 -99.7% -95% 68% The figure illustrates a normal distribution for the prices paid for a particular model of a new car. The mean is $13,000 and the standard deviation is $500. Use the 68-95-99.7 Rule to find the percentage of buyers who paid between $11,500 and $13,000. Number of Car Buyers 11.300 12.000 12.500 13.000 0.00 14.000 Price of a Model of a New Car 14.500 What percentage of buyers paid between $11,500 and $13,000?
The graph illustrates the distribution of test scores taken by College Algebra students. The maximum possible...
The graph illustrates the distribution of test scores taken by College Algebra students. The maximum possible score on the test was 120, while the mean score was 79 and the standard deviation was 8. 55,63,71,79,87,95,103 Distribution of Test Scores What is the approximate percentage of students who scored between 79 and 103 on the test? % What is the approximate percentage of students who scored lower than 55 on the test? % What is the approximate percentage of students who...
The graph illustrates the distribution of test scores taken by College Algebra students. The maximum possible...
 The graph illustrates the distribution of test scores taken by
College Algebra students. The maximum possible score on the test
was 130, while the mean score was 77 and the standard deviation was
13. 38 51 64 77 90 103 116 Distribution of Test Scores What is the
approximate percentage of students who scored higher than 103 on
the test? % What is the approximate percentage of students who
scored between 64 and 77? % What is the approximate percentage...
The graph illustrates the distribution of test scores taken by
College Algebra students. The maximum possible score on the test
was 130, while the mean score was 77 and the standard deviation was
13. 38 51 64 77 90 103 116 Distribution of Test Scores What is the
approximate percentage of students who scored higher than 103 on
the test? % What is the approximate percentage of students who
scored between 64 and 77? % What is the approximate percentage...
The graph illustrates the distribution of test scores taken by College Algebra students. The maximum possible...
 The graph illustrates the distribution of test scores taken by College Algebra students. The maximum possible score on the test was 140, while the mean score was 79 and the standard deviation was 15. 34 49 64 79 94 109 124 Distribution of Test Scores What is the approximate percentage students who scored between 64 and 94 on the test? What is the approximate percentage of students who scored lower than 34 on the test? What is the approximate percentage...
The graph illustrates the distribution of test scores taken by College Algebra students. The maximum possible...
 The graph illustrates the distribution of test scores taken by College Algebra students. The maximum possible score on the test was 140, while the mean score was 75 and the standard deviation was 15. 30 45 105 120 60 75 90 Distribution of Test Scores Using the Empirical Rule, What is the approximate percentage of students who scored between 45 and 105 on the test? % What is the approximate percentage of students who scored higher than 105 on the...
 The graph illustrates a normal distribution for the prices paid for a particular model of HD television. The mean price paid is $1800 and the standard deviation is $150. 1350 7500 2100 2250 1650 1800 1950 Distribution of Prices What is the approximate percentage of buyers who paid less than $1500? What is the approximate percentage of buyers who paid less than $1350? What is the approximate percentage of buyers who paid between $1650 and $1800? What is the approximate...
 The graph illustrates a normal distribution for the prices paid for a particular model of HD television. The mean price paid is $1400 and the standard deviation is $105. + 1085 1190 1295 1400 1505 1610 1715 Distribution of Prices What is the approximate percentage of buyers who paid less than $1190? % What is the approximate percentage of buyers who paid between $1085 and $1400? at% What is the approximate percentage of buyers who paid between $1190 and $1400?...
 The graph illustrates a normal distribution for the prices paid for a particular model of HD television. The mean price paid is $1400 and the standard deviation is $105. 1085 1295 1610 1715 1190 1400 1505 Distribution of Prices What is the approximate percentage of buyers who paid less than $1190? 2.5 % What is the approximate percentage of buyers who paid between $1085 and $1400? 4% What is the approximate percentage of buyers who paid between $1190 and $1400?...
 The graph illustrates the distribution of test scores taken by
College Algebra students. The maximum possible score on the test
was 140, while the mean score was 71 and the standard deviation was
15.
1. What is the approximate percentage of students who scored
higher than 101 on the test?
2. What is the approximate percentage of students who scored
between 41 and 101 on the test?
3. What is the approximate percentage of students who scored
lower than 26...
The graph illustrates the distribution of test scores taken by
College Algebra students. The maximum possible score on the test
was 140, while the mean score was 71 and the standard deviation was
15.
1. What is the approximate percentage of students who scored
higher than 101 on the test?
2. What is the approximate percentage of students who scored
between 41 and 101 on the test?
3. What is the approximate percentage of students who scored
lower than 26...
 -99.7% -95% 68% The figure illustrates a normal distribution for the prices paid for a particular model of a new car. The mean is $13,000 and the standard deviation is $500. Use the 68-95-99.7 Rule to find the percentage of buyers who paid between $11,500 and $13,000. Number of Car Buyers 11.300 12.000 12.500 13.000 0.00 14.000 Price of a Model of a New Car 14.500 What percentage of buyers paid between $11,500 and $13,000?
 The graph illustrates the distribution of test scores taken by
College Algebra students. The maximum possible score on the test
was 130, while the mean score was 77 and the standard deviation was
13. 38 51 64 77 90 103 116 Distribution of Test Scores What is the
approximate percentage of students who scored higher than 103 on
the test? % What is the approximate percentage of students who
scored between 64 and 77? % What is the approximate percentage...
The graph illustrates the distribution of test scores taken by
College Algebra students. The maximum possible score on the test
was 130, while the mean score was 77 and the standard deviation was
13. 38 51 64 77 90 103 116 Distribution of Test Scores What is the
approximate percentage of students who scored higher than 103 on
the test? % What is the approximate percentage of students who
scored between 64 and 77? % What is the approximate percentage...
 The graph illustrates the distribution of test scores taken by College Algebra students. The maximum possible score on the test was 140, while the mean score was 79 and the standard deviation was 15. 34 49 64 79 94 109 124 Distribution of Test Scores What is the approximate percentage students who scored between 64 and 94 on the test? What is the approximate percentage of students who scored lower than 34 on the test? What is the approximate percentage...
 The graph illustrates the distribution of test scores taken by College Algebra students. The maximum possible score on the test was 140, while the mean score was 75 and the standard deviation was 15. 30 45 105 120 60 75 90 Distribution of Test Scores Using the Empirical Rule, What is the approximate percentage of students who scored between 45 and 105 on the test? % What is the approximate percentage of students who scored higher than 105 on the...
Most questions answered within 3 hours.
-
a)An ideal heat pump is being considered for use in heating an
environment with a temperature...
asked 1 minute from now -
.
Convert the following pairs of voltage and current waveforms to
phasor form. Each pair of...
asked 4 seconds ago -
I need new and unique answers, please. (Use your own words,
don't copy and paste), Please...
asked 1 minute ago -
A 6.5 cm diameter ball has a terminal speed of 22 m/s. What is
the ball's...
asked 14 minutes ago -
Name two areas of the human body with the highest concentration
of lymph nodes and speculate...
asked 17 minutes ago -
Angel Corporation has $10,000,000 of
8.0% 25 year bonds dated May 1, 2018 with interest payable...
asked 52 minutes ago -
7.
________ involves individuals trading goods they already have or
providing services in exchange for something...
asked 56 minutes ago -
Share your research problem. What databases did you search as
you gathered evidence to support your...
asked 56 minutes ago -
what process occurs to form microspores and megaspores in flowering
plants?
asked 1 hour ago -
C++
I need to use the function getData to put in all my data using
arrays....
asked 1 hour ago -
A block is hung by a string from the inside roof of a van. When
the...
asked 1 hour ago -
Do you think companies should not go for long term debt in their
capital structure to...
asked 1 hour ago