


Homework Answers
(a)
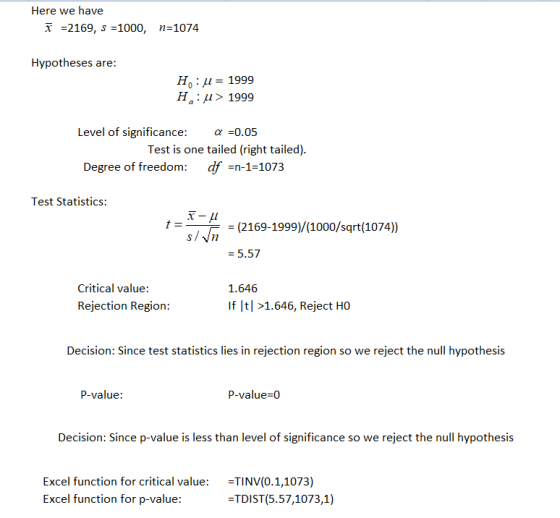
From table,
The p-value is
0 < p-value < 0.0005
Since p-value is less than level of significance so we reject the null hypothesis.
(b)

From table,
The p-value is
0.001 < p-value < 0.005
Since p-value is less than level of significance so we reject the null hypothesis.
(c)
The second scenario produces greater p-value. This makes sense because a larger standard deviation will result in a smaller test statistics ad therefore a larger p-value.
Add Answer to:
The Nellie Mae organization found that in a random sample of undergraduate students taken in 2004,...
A random sample of size n= 15 obtained from a population that is normally distributed results...
 A random sample of size n= 15 obtained from a population that is normally distributed results in a sample mean of 45.8 and sample standard deviation 12.2. An independent sample of size n = 20 obtained from a population that is normally distributed results in a sample mean of 51.9 and sample standard deviation 14.6. Does this constitute sufficient evidence to conclude that the population means differ at the a = 0.05 level of significance? Click here to view the...
A simple random sample of size n=40 is drawn from a population. The sample mean is...
A simple random sample of size n=40 is drawn from a population. The sample mean is found to be 106.9,and the sample standard deviation is found to be 15.1. Is the population mean greater than 100 at the α=0.025 level of significance? A) Determine the null and alternative hypotheses. B) Compute the test statistic C) Determine the P-value. (Round to three decimal places as needed.) D) What is the result of the hypothesis test? ____ the null hypothesis because the...
In a study entitled How Undergraduate Students Use Credit Cards, it was reported that undergraduate students...
In a study entitled How Undergraduate Students Use Credit Cards, it was reported that undergraduate students have a mean credit card balance of $3,304. This figure was an all-time high and had increased 41% over the previous five years. Assume that a current study is being conducted to determine if it can be concluded that the mean credit card balance for undergraduate students has continued to increase compared to the report. Based on previous studies, use a population standard deviation...
NCAA Football Coach Salaries: A simple random sample of 40 salaries of NCAA football coaches in...
NCAA Football Coach Salaries: A simple random sample of 40 salaries of NCAA football coaches in NCAA has a mean of $459,953 and standard deviation of $39,000. Use a 0.05 significance level to test the claim that the mean salary of a football coach in NCAA is less than $480,000. What is the null hypothesis? What is the alternative hypothesis? What is the p-value and the test statistic? Do we reject the null or fail to reject the null? Write...
A random sample of 172 marketing students was asked to rate, on a scale from 1...
 A random sample of 172 marketing students was asked to rate, on
a scale from 1 (not important) to 5 (extremely important), health
benefits as a job characteristic. The sample mean rating was 4.06,
and the sample standard deviation was 0.6. Test at the 1%
significance level the null hypothesis that the population mean
rating is at most 4 against the alternative that it is larger than
4.
What are the null and alternative hypotheses for this test?
For this...
A random sample of 172 marketing students was asked to rate, on
a scale from 1 (not important) to 5 (extremely important), health
benefits as a job characteristic. The sample mean rating was 4.06,
and the sample standard deviation was 0.6. Test at the 1%
significance level the null hypothesis that the population mean
rating is at most 4 against the alternative that it is larger than
4.
What are the null and alternative hypotheses for this test?
For this...
FULL SCREEN PRINTER VERSION BACK NEXTH An experiment investigated the effectiveness of a nicotine lozenge for...
 FULL SCREEN PRINTER VERSION BACK NEXTH An experiment investigated the effectiveness of a nicotine lozenge for subjects who wanted to quit smoking (Shilfman et al, 2002). Before the treatments began, subjects answered background questions, including how many cigarettes they smoked per day, Among the 1818 subjects in the study, the average was 22.0 per day, and the standard deviation was 10.8 ogarettes per day a. Use these sample statistics to test whether or not the population mean differs from 20...
Test the claim that the mean GPA of night students is smaller than 2.8 at the...
 Test the claim that the mean GPA of night students is smaller than 2.8 at the .10 significance level. The null and alternative hypothesis would be: H1 : p < 0.7 H1ιμ>2.8 H1 : μ < 2.8 Ho:p 0.7 Ho:p 0.7 Ho: 2.8 The test is: left-tailed right-tailed two-tailed Based on a sample of 65 people, the sample mean GPA was 2.76 with a standard deviation of 0.05 The test statistic is: decimals) The critical value is: decimals) Based on...
. In a study entitled How Undergraduate Students Use Credit Cards, it was reported that undergraduate...
. In a study entitled How Undergraduate Students Use Credit Cards, it was reported that undergraduate students have a mean credit card balance of $3173 (Sallie Mae, April 2009). This figure was an all-time high and had increased 44% over the previous five years. Assume that a current study is being conducted to determine if it can be concluded that the mean credit card balance for undergraduate students has continued to increase compared to the April 2009 report. Based on...
A group of undergraduate students at Cal Poly (Mintz, Mintz, Moore, and Schuh, 2002) conducted a study examining h...
 A group of undergraduate students at Cal Poly (Mintz, Mintz, Moore, and Schuh, 2002) conducted a study examining how much weight students carry in their backpacks. They weighed the backpacks of 100 students and compared the distributions of backpack weights between men and women. The student researchers also recorded the body weight of each student and computed the ratio of backpack weight to body weight for each student. a. Is this ratio a categorical or quantitative variable? b. Conduct a...
Suppose production specifications for a new energy drink require exactly 40 mg of vitamins per serving. Fred, a quality...
 Suppose production specifications for a new energy drink require exactly 40 mg of vitamins per serving. Fred, a quality control engineer, suspects that the production process does not ensure each serving contains 40 mg of vitamins, on average To test his suspicions, Fred collects a random sample of 8 servings and determines their average vitamin content to be 34.9985 mg with a standard deviation of 6.9871 mg. Fred uses a 95% confidence interval to test the null hypothesis Ho: μ-μο...
 A random sample of size n= 15 obtained from a population that is normally distributed results in a sample mean of 45.8 and sample standard deviation 12.2. An independent sample of size n = 20 obtained from a population that is normally distributed results in a sample mean of 51.9 and sample standard deviation 14.6. Does this constitute sufficient evidence to conclude that the population means differ at the a = 0.05 level of significance? Click here to view the...
 A random sample of 172 marketing students was asked to rate, on
a scale from 1 (not important) to 5 (extremely important), health
benefits as a job characteristic. The sample mean rating was 4.06,
and the sample standard deviation was 0.6. Test at the 1%
significance level the null hypothesis that the population mean
rating is at most 4 against the alternative that it is larger than
4.
What are the null and alternative hypotheses for this test?
For this...
A random sample of 172 marketing students was asked to rate, on
a scale from 1 (not important) to 5 (extremely important), health
benefits as a job characteristic. The sample mean rating was 4.06,
and the sample standard deviation was 0.6. Test at the 1%
significance level the null hypothesis that the population mean
rating is at most 4 against the alternative that it is larger than
4.
What are the null and alternative hypotheses for this test?
For this...
 FULL SCREEN PRINTER VERSION BACK NEXTH An experiment investigated the effectiveness of a nicotine lozenge for subjects who wanted to quit smoking (Shilfman et al, 2002). Before the treatments began, subjects answered background questions, including how many cigarettes they smoked per day, Among the 1818 subjects in the study, the average was 22.0 per day, and the standard deviation was 10.8 ogarettes per day a. Use these sample statistics to test whether or not the population mean differs from 20...
 Test the claim that the mean GPA of night students is smaller than 2.8 at the .10 significance level. The null and alternative hypothesis would be: H1 : p < 0.7 H1ιμ>2.8 H1 : μ < 2.8 Ho:p 0.7 Ho:p 0.7 Ho: 2.8 The test is: left-tailed right-tailed two-tailed Based on a sample of 65 people, the sample mean GPA was 2.76 with a standard deviation of 0.05 The test statistic is: decimals) The critical value is: decimals) Based on...
 A group of undergraduate students at Cal Poly (Mintz, Mintz, Moore, and Schuh, 2002) conducted a study examining how much weight students carry in their backpacks. They weighed the backpacks of 100 students and compared the distributions of backpack weights between men and women. The student researchers also recorded the body weight of each student and computed the ratio of backpack weight to body weight for each student. a. Is this ratio a categorical or quantitative variable? b. Conduct a...
 Suppose production specifications for a new energy drink require exactly 40 mg of vitamins per serving. Fred, a quality control engineer, suspects that the production process does not ensure each serving contains 40 mg of vitamins, on average To test his suspicions, Fred collects a random sample of 8 servings and determines their average vitamin content to be 34.9985 mg with a standard deviation of 6.9871 mg. Fred uses a 95% confidence interval to test the null hypothesis Ho: μ-μο...
Most questions answered within 3 hours.
-
Let X be a continuous random variable whose PDF is Let X be a
continuous random...
asked 12 minutes ago -
Martinez Company’s relevant range of production is 7,500 units
to 12,500 units. When it produces and...
asked 10 minutes ago -
A football with a mass of 1.2 kg is kicked from ground level to
a height...
asked 16 minutes ago -
Remember: Changes in supply determinants shift supply, and
changes in demand determinants shift demand. We say...
asked 14 minutes ago -
Why is the answer b), for this question? I came up with C) for
my incorrect...
asked 21 minutes ago -
Suppose that you know that in the population of full-time
employees in the United States, the...
asked 43 minutes ago -
This experiment was designed originally to sample various meat and carcass quality
aspects of Ontario pigs...
asked 43 minutes ago -
Dopamine Hydrochloride: draw the structure And Show the
functional groups in different colors and label the...
asked 35 minutes ago -
A rope supports a 10 kg dumbbell hanging from it. What is the
tension in the...
asked 35 minutes ago -
) Raw materials are studied for contamination. Suppose that
the number of particles of contamination per...
asked 57 minutes ago -
After running a regression analysis we calculated an F test and
the significance level was 0.15....
asked 53 minutes ago -
----Can someone please help me solve this one using JAVA
----I thank you in advance
Create...
asked 58 minutes ago