1) comapre?
|
survived |
Mean |
Median |
Variance |
Std. dev. |
Q1 |
Q3 |
IQR |
|
NO |
30.545369 |
28 |
193.83708 |
13.922539 |
21 |
39 |
18 |
|
YES |
28.918228 |
28 |
226.84822 |
15.061481 |
20 |
38 |
18 |
2) aWhich passenger groups were more likely to have survived than others? Explain briefly.
|
Cell format |
|
Count (Row percent) (Column percent) |
|
1 |
2 |
3 |
Total |
|
|
0 |
123 (15.2%) (38.08%) |
158 (19.53%) (57.04%) |
528 (65.27%) (74.47%) |
809 (100%) (61.8%) |
|
1 |
200 (40%) (61.92%) |
119 (23.8%) (42.96%) |
181 (36.2%) (25.53%) |
500 (100%) (38.2%) |
|
Total |
323 (24.68%) (100%) |
277 (21.16%) (100%) |
709 (54.16%) (100%) |
1309 (100%) (100%) |
b)
What percent of the survivors were in third class? What percent of all passengers were third-class passengers who survived? What percent of the third-class passengers survived?
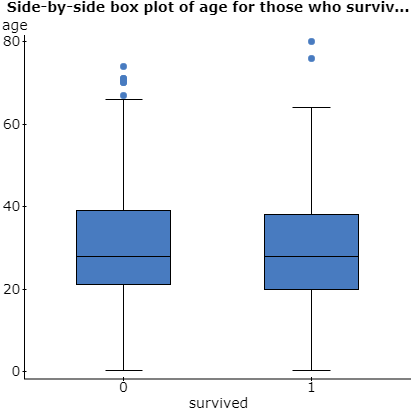
3) what kind of shape can you expect for each of the two distributions? Compare the distribution of age of survivors and nonsurvivors.
0=died 1= survived
Homework Answers


Add Answer to:
1) comapre?
survived
Mean
Median
Variance
Std. dev.
Q1
Q3
IQR
NO
30.545369
28
193.83708
13.922539...
Most questions answered within 3 hours.
-
1. The correlation coefficient determined for two variables has
a value of 0.89. Describe, in words,...
asked 2 seconds ago -
Kyle, a 95.0 kg football player, leaps straight up into the air
(with no horizontal velocity)...
asked 22 minutes ago -
Which of the following is a measure of profitability?
A.
Quick (acid-test) ratio
B.
Net sales...
asked 25 minutes ago -
Find the total pressure exerted by 2 grams of ethane and 3 grams
of CO2 contained...
asked 26 minutes ago -
A fireman standing on a 5.2 m high ladder operates a water hose
with a round...
asked 22 minutes ago -
A cream formulation is studied for accelerated stability study.
Creaming was observed when formulation was tested...
asked 25 minutes ago -
A 1,150 lumen light bulb is placed 37 cm in front of a mirrored
wall, whose...
asked 35 minutes ago -
Given that z is a standard normal random variable, compute the
following probabilities (to 4 decimals)....
asked 42 minutes ago -
You begin preparation of the calibration curve to measure
absorbance vs concentration of FeSCN2+. To do...
asked 59 minutes ago -
When you speak after breathing helium, in which the speed of
sound is much greater than...
asked 52 minutes ago -
3. Stock Valuation: You are the CEO of Under Armour, Inc. and
are thinking about how...
asked 56 minutes ago -
Choose a brand. Critique the brand in terms of its brand
positioning, brand identity and brand...
asked 59 minutes ago