Question1 Describe and illustrate the expected relationship between risk and expected return based on security market...
Question1
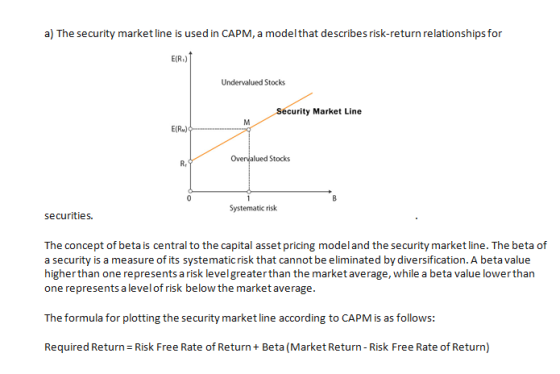
- Describe and illustrate the expected relationship between risk and expected return based on security market line (SML) (7mark)
- Hwang DBS Bhd has identified three potential stocks to buy in
FBM KLCU but will only pick two to be added in the portfolio. The
following information has been collected:
AirAsia
Daya Material
Muhibbah Engineering
Expected return
12%
25%
18%
Standard deviation of return
2.2
5.9
3.4
|
Covariances of returns between companies |
|
|
AirAsia and Daya Material |
8.2 |
|
AirAsia and Muhibbah Engineering |
2.5 |
|
Daya Material and Muhibbah Engineering |
17.6 |
(i)Estimate the correlation coefficients between each of the three possible portfolio combinations and explain the implications of these coefficients for portfolio risk. (9mark)
(ii)Calculate the expected rate of return and standard deviation for each of the three possible 2-stock portfolios, and indicate which portfolio has the most efficient risk-return profile. (14mark)
Homework Answers


Add Answer to:
Question1
Describe and illustrate the expected relationship between risk
and expected return based on security market...
Describe and illustrate the expected relationship between risk and expected return based on security market line...
Describe and illustrate the expected relationship between risk and expected return based on security market line (SML) Hwang DBS Bhd has identified three potential stocks to buy in FBM KLCU but will only pick two to be added in the portfolio. The following information has been collected: AirAsia Daya Material Muhibbah Engineering Expected return 12% 25% 18% Standard deviation of return 2.2 5.9 3.4 Covariances of returns between companies AirAsia and Daya Material 8.2 AirAsia and Muhibbah Engineering 2.5 Daya...
5. The Capital Market Line and the Security Market Line Aa Aa E In the following...
 5. The Capital Market Line and the Security Market Line Aa Aa E In the following table, indicate whether each statement refers to the Capital Market Line (CML) or to the Security Market Line (SML). Capital Market Line (CML) Security Market Line (SML) Statement This line defines the linear relationship between the expected return on an efficient portfolio and its standard deviation. The slope of this line, TM - PRF) / OM, reflects the investors' aggregated, or market-level, expected premium...
5. The Capital Market Line and the Security Market Line In the following table, check whether...
5. The Capital Market Line and the Security Market Line In the following table, check whether each statement refers to the Capital Market Line (CML) or to the Security Market Line (SML). Statement Capital Market Line (CML) Security Market Line (SML) This line defines the linear relationship between the expected return on an efficient portfolio and its standard deviation. The slope of this line, (r̂Mr̂M – rRFrRF)/σMσM, reflects the investors’ aggregated, or market-level, expected premium for risk. This line describes...
(2*5) Consider a market with many risky assets and a risk-free security. Asset’s returns are not...
(2*5) Consider a market with many risky assets and a risk-free security. Asset’s returns are not perfectly correlated. All the CAPM assumptions hold and the market is in equilibrium. The risk-free rate is 5%, the expected return on the market is 15%. Mr. T and Mrs. R are two investors with mean-variance utility functions and different risk-aversion coefficients. They both invest into efficient portfolios composed of the market portfolio and the risk-free security. Mr. T’s portfolio has an expected return...
What is the expected return of a portfolio consisting of 60% security 1 and 40% security...
 What is the expected return of a portfolio consisting of 60% security 1 and 40% security 2? What is the beta of a portfolio consisting of 60% security 1 and 40% security 2? What is the standard deviation of a portfolio consisting of 60% security 1 and 40% security 2 if the correlation coefficient between securities is zero? What should be the weight of security 1 in a portfolio consisting of security 1 abd 2 to minimize the portfolios standard...
There are three assets, A, B and C, where A is the market portfolio and C...
There are three assets, A, B and C, where A is the market portfolio and C is the risk-free asset. The return on the market has a mean of 12% and a standard deviation of 20%. The risk-free asset yields a return of 4%. Asset B is a risky asset whose return has a standard deviation of 40% and a market beta of 1. Assume that the CAPM holds. Compute the expected return of asset B and its covariances with...
Expected Portfolio Return Beta 22 0.8 A Market 173 1.0 D) Expected Portfolio Return Beta 30.28 1.8 A Market 198 1.0 If...
 Expected Portfolio Return Beta 22 0.8 A Market 173 1.0 D) Expected Portfolio Return Beta 30.28 1.8 A Market 198 1.0 If the simple CAPM is valid and all portfolios are priced correctly, which of the situations below is possible? Consider each situation independently, and assume the risk-free rate is 5% A) Expected Portfolio Return Beta 198 0.8 Market 198 1.0 B) Expected Standard Return Deviation Portfolio 228 88 A Market 17B 168
In the following table, indicate whether each statement refers to the Capital Market Line (CML) or...
 In the following table, indicate whether each statement refers to the Capital Market Line (CML) or to the Security Market Line (SML). Capital Market Line (CML) Security Market Line (SML) Statement This line defines the linear relationship between the expected return on an efficient portfolio and its standard deviation The slope of this line, th risk. - TRP/OM, reflects the investors' aggregated, or market-level, expected premium for This line describes the return on an individual security as the sum of...
Asset W has an expected return of 12.3 percent and a beta of 1.2. If the...
 Asset W has an expected return of 12.3 percent and a beta of 1.2. If the risk-free rate is 4 percent, complete the following table for portfolios of Asset W and a risk-free asset. Consider the relationship between portfolio expected return and portfolio beta. What is the slope of the security market line (SML)?
Computing the expected rate o return and risk After a tumultuous period in the stock market...
 Computing the expected rate o return and risk After a tumultuous period in the stock market Logan Morgan s considering an investment n on standard deviation) and return as measured by the expected rate of return? o portfolios ven the i o ation that ollows which mes ent is better based on risk as measured by th o Portfolio A Portfolio B Return -4% 1796 23% Return 4% 10% 10% 16% 0.05 0.32 0.35 028 0.22 0.32 a. The expected...
 5. The Capital Market Line and the Security Market Line Aa Aa E In the following table, indicate whether each statement refers to the Capital Market Line (CML) or to the Security Market Line (SML). Capital Market Line (CML) Security Market Line (SML) Statement This line defines the linear relationship between the expected return on an efficient portfolio and its standard deviation. The slope of this line, TM - PRF) / OM, reflects the investors' aggregated, or market-level, expected premium...
 What is the expected return of a portfolio consisting of 60% security 1 and 40% security 2? What is the beta of a portfolio consisting of 60% security 1 and 40% security 2? What is the standard deviation of a portfolio consisting of 60% security 1 and 40% security 2 if the correlation coefficient between securities is zero? What should be the weight of security 1 in a portfolio consisting of security 1 abd 2 to minimize the portfolios standard...
 Expected Portfolio Return Beta 22 0.8 A Market 173 1.0 D) Expected Portfolio Return Beta 30.28 1.8 A Market 198 1.0 If the simple CAPM is valid and all portfolios are priced correctly, which of the situations below is possible? Consider each situation independently, and assume the risk-free rate is 5% A) Expected Portfolio Return Beta 198 0.8 Market 198 1.0 B) Expected Standard Return Deviation Portfolio 228 88 A Market 17B 168
 In the following table, indicate whether each statement refers to the Capital Market Line (CML) or to the Security Market Line (SML). Capital Market Line (CML) Security Market Line (SML) Statement This line defines the linear relationship between the expected return on an efficient portfolio and its standard deviation The slope of this line, th risk. - TRP/OM, reflects the investors' aggregated, or market-level, expected premium for This line describes the return on an individual security as the sum of...
 Asset W has an expected return of 12.3 percent and a beta of 1.2. If the risk-free rate is 4 percent, complete the following table for portfolios of Asset W and a risk-free asset. Consider the relationship between portfolio expected return and portfolio beta. What is the slope of the security market line (SML)?
 Computing the expected rate o return and risk After a tumultuous period in the stock market Logan Morgan s considering an investment n on standard deviation) and return as measured by the expected rate of return? o portfolios ven the i o ation that ollows which mes ent is better based on risk as measured by th o Portfolio A Portfolio B Return -4% 1796 23% Return 4% 10% 10% 16% 0.05 0.32 0.35 028 0.22 0.32 a. The expected...
Most questions answered within 3 hours.
-
1. Methods of collecting data - Experiments and direct
observation
In each of the following situations,...
asked 10 minutes ago -
Each protein is composed of a maximum of ____________ different
amino acids in varying numbers and...
asked 27 minutes ago -
One member in the comp set that did not have supply, demand, and
revenue data. What...
asked 5 minutes ago -
What is the density of a substance that takes up 3.4e3 cubic cm
and weighs 1.96...
asked 20 minutes ago -
Consider a single wire loop of radius a. Calculate the magnetic
field B(z) along the axis...
asked 16 minutes ago -
For each of the compounds listed below you must draw the Lewis
dot structure in the...
asked 19 minutes ago -
1. Hypothesize in what type of environments it would be
advantageous for a protist to be...
asked 18 minutes ago -
The mayor of a town has proposed a plan for the construction of
a new community....
asked 37 minutes ago -
2. KopyKat is a firm that specializes in printing business cards
using the latest laser technology....
asked 56 minutes ago -
What type of stock pays dividends in arrears?
A.
Nonminus−cumulative
preferred stock
B.
Cumulative preferred stock...
asked 55 minutes ago -
Discuss what issues you see as needing to be addressed in an
organization in order to...
asked 56 minutes ago -
Why does varying input frequency to a buck converter affect the
magnitude of the output voltage...
asked 59 minutes ago